Mac Kernel Panic & Random Restarts on macOS Tahoe 26.5: Read the Panic Log and Fix It
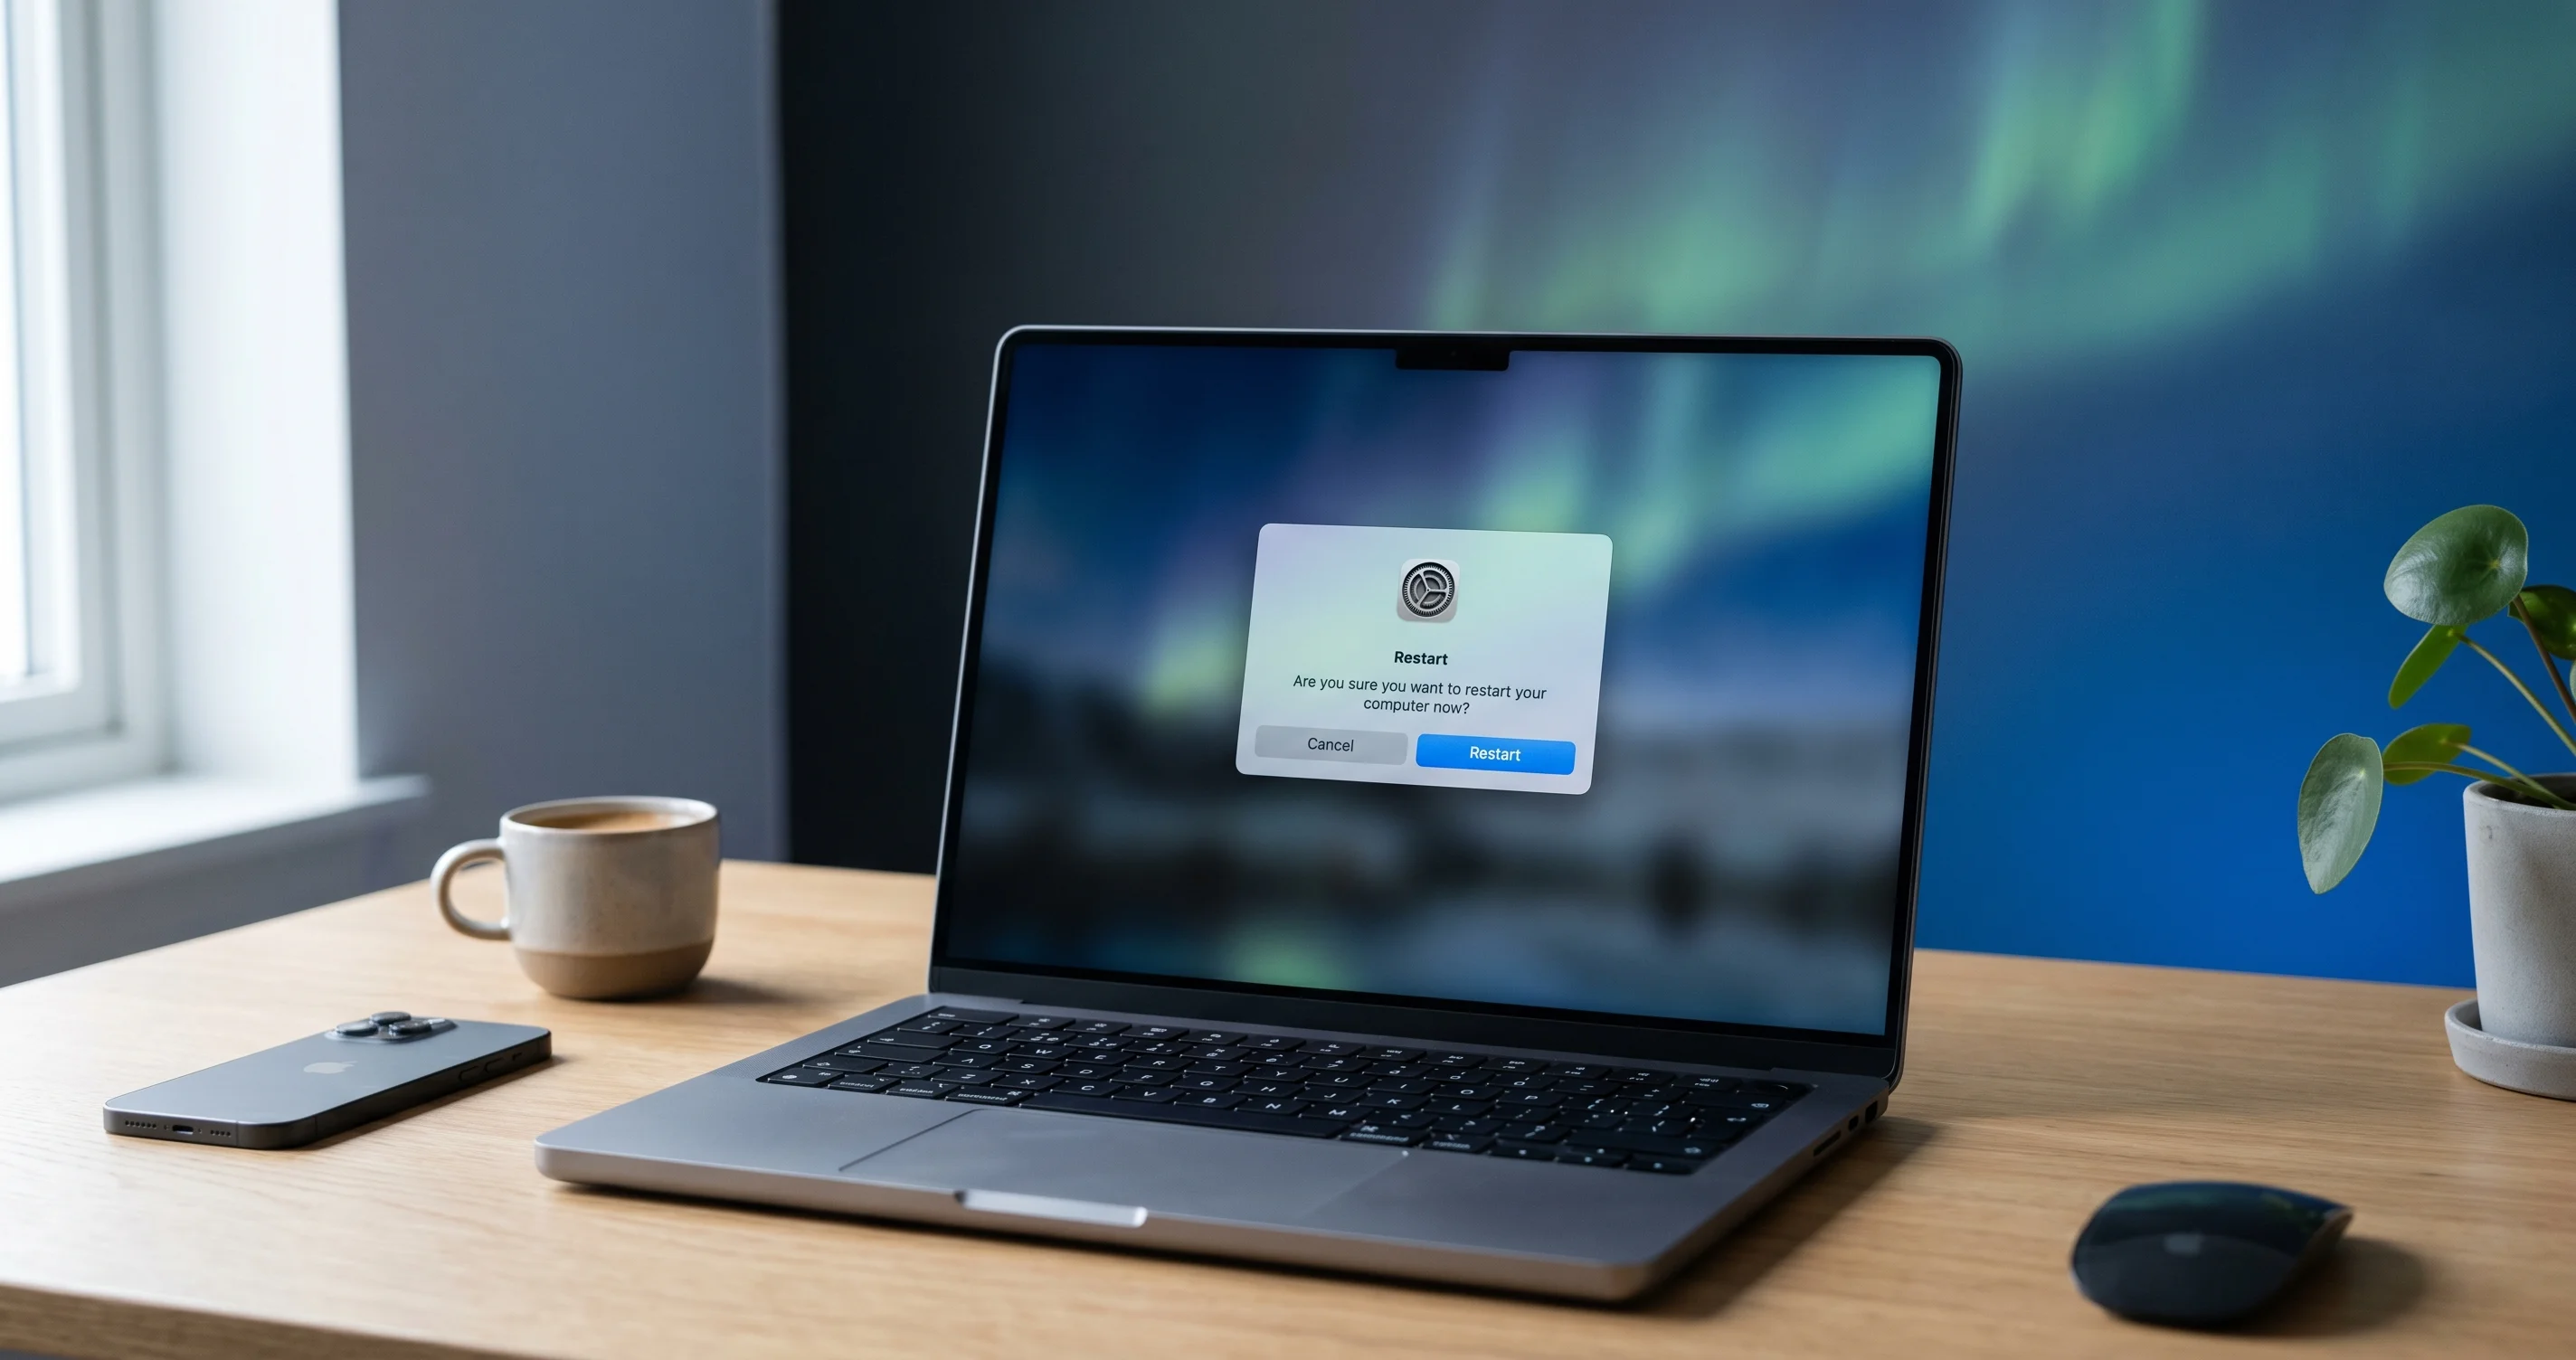
Mac kernel panicking or restarting on macOS Tahoe 26.5? Read the panic log and fix refresh-rate, kernel-extension, sleep-wake, and peripheral causes.
You are mid-sentence in a document, or rendering a timeline, or just reading a webpage, and the screen goes black. A few seconds later your Mac is sitting at the login window with a dialog that reads "Your computer restarted because of a problem." That is a kernel panic, and on macOS Tahoe 26.5 it has become one of the most reported "the whole machine just died" complaints in support forums and developer threads. A kernel panic is not an app crashing — it is the operating system's core deciding that continuing would be unsafe, so it halts everything and reboots.
The good news is that a Mac kernel panic almost always leaves a fingerprint behind: a panic report. Buried in that report is a panicString, a backtrace, and a list of kernel extensions that were in memory when the crash happened. Once you can read those three things, you stop guessing and start diagnosing. This guide is built around that skill. We will read a real panic report line by line, then walk a decision tree that maps what you find to the most common Tahoe 26.5 triggers — high external-monitor refresh rates, kernel and system extensions, sleep/wake failures with peripherals, the hardware items Apple itself acknowledged in the 26.5 release, and corrupted system state.
macOS Tahoe 26.5 shipped on 2026-05-11, and like every point release it fixed some problems and surfaced others. Apple's enterprise release notes acknowledged restart fixes affecting M5 MacBook Air and M5 Pro/Max models, content-filter network extensions causing restarts, and a black-screen-after-update condition. That context matters because it tells you Apple knows kernel-level stability regressions exist in this generation. But not every panic is Apple's bug to fix — many are caused by a third-party display running too fast, an old VPN kext, or a flaky Thunderbolt hub. The panic log is how you tell which is which.
Key Takeaways
- A kernel panic is a whole-system restart triggered by the OS core, not an app crash — and it always writes a panic report to
/Library/Logs/DiagnosticReports/that names the likely cause. - Read three fields first: the
panicString(the human-readable reason), the backtrace (which process/driver was running), and "Kernel Extensions in backtrace" (third-party drivers implicated). - The cleanest, most community-confirmed Tahoe 26.5 fix is dropping a third-party external display from 120/144/240 Hz down to 60 Hz — high-refresh-rate GPU/display panics on Mac Studio and Mac mini are widespread and resolve instantly when the rate is lowered.
- Audit kernel and system extensions with
kmutil showloadedandsystemextensionsctl list, then boot Safe Mode to prove whether a third-party extension is the trigger; VPN, antivirus, and virtualization tools are the usual suspects. - Apple acknowledged 26.5 restart fixes for M5 MacBook Air / M5 Pro & Max, content-filter extensions, and black-screen-after-update; remaining panics are community-reported with workarounds, so update fully, then isolate methodically before assuming hardware failure.
Kernel Panic vs App Crash vs Freeze: Know What You're Looking At
Before you open a single log, get the terminology right, because the fix path is completely different for each.
A kernel panic is a failure inside the XNU kernel — the lowest layer of macOS that talks directly to the CPU, GPU, memory controller, and drivers. When the kernel hits a state it cannot safely recover from (a bad memory access in a driver, a hardware fault, a deadlock in a critical path), it deliberately halts the whole system and restarts. The telltale sign is the post-reboot dialog: "Your computer restarted because of a problem. Press a key or wait a few seconds to continue starting up." On older or Intel Macs you may briefly see a darkened screen with "You need to restart your computer. Hold down the Power button..." in multiple languages. Either way, the entire machine went down, not just one app.
An app crash is a single process quitting unexpectedly. The rest of macOS keeps running, you get a "[App] quit unexpectedly" dialog with Reopen/Report buttons, and you can keep using everything else. App crashes write .crash or .ips reports too, but they are scoped to one process. If your Safari tabs die but the Dock, Finder, and other apps stay alive, that is an app crash, not a panic — and it is covered by our separate guide on Safari tab crashes on macOS Tahoe 26.5.
A freeze or hang is when the system stops responding but does not restart. The cursor may become a spinning beach ball, the screen is frozen, and nothing reacts — but there is no automatic reboot. A hang can sometimes precede a panic (the kernel locks up, then trips a watchdog that forces a restart), but a pure hang you have to power-cycle yourself. The diagnostic for hangs is different — spindump, Activity Monitor's "sample process," and log show for the period before the hang.
Here is the quick decision:
- Whole machine rebooted by itself + "restarted because of a problem" dialog → kernel panic. Read the panic report. That is this guide.
- One app quit, rest of system fine → app crash. Look at that app's
.ipsreport. - System frozen, no reboot, you had to force-power-off → hang. Different toolset.
Getting this right saves hours. People spend days reinstalling apps to fix a "crash" that was actually a kernel panic caused by a 240 Hz monitor.
How to Find and Read the Panic Report
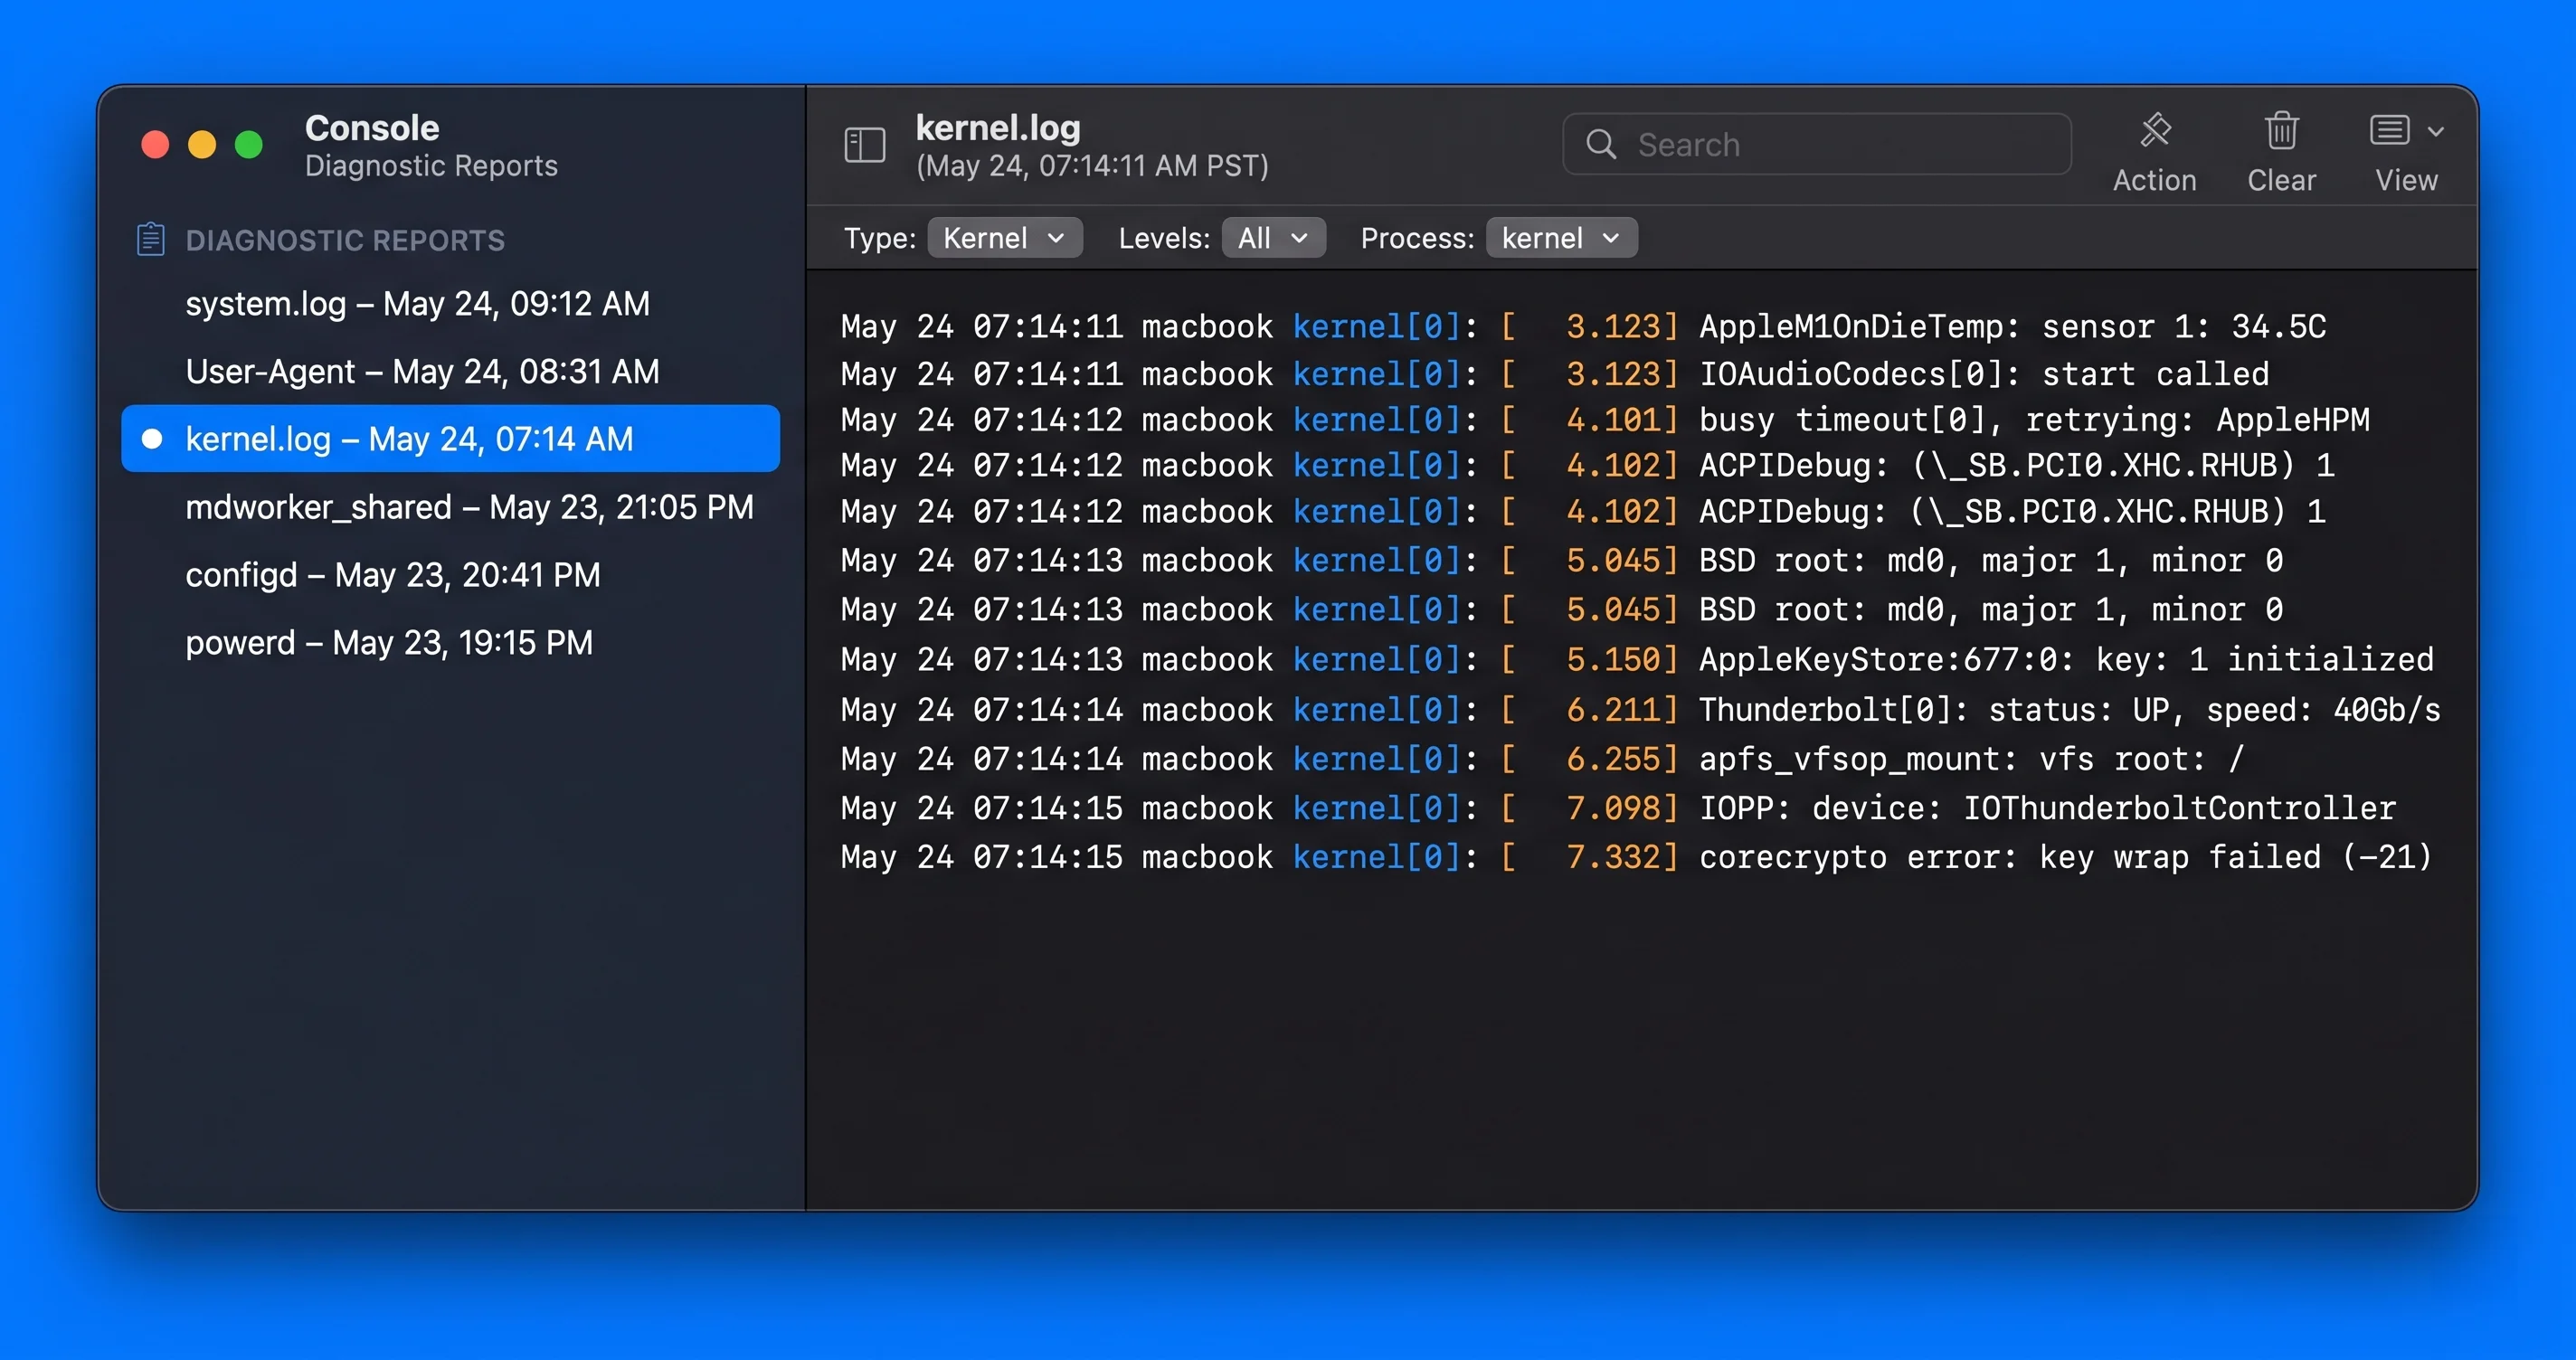
Every kernel panic on macOS writes a diagnostic report. There are two ways to get to it: Console.app (graphical) and the file system / Terminal (faster and scriptable).
Where panic logs live
Panic reports are stored here:
# Per-machine diagnostic reports (kernel panics live here)
ls -lt /Library/Logs/DiagnosticReports/ | head -20
You are looking for files named like Kernel-2026-05-22-143012.panic or panic-full-2026-05-22-143012.ips. The newest ones are at the top because of -lt (sort by time). On Apple silicon, recent macOS versions write a richer panic-full report; on older systems you may see .panic text files. There is also a user-level folder, but kernel panics are system-wide and go in /Library/Logs/DiagnosticReports/.
To list only panic-related reports:
ls -lt /Library/Logs/DiagnosticReports/ | grep -iE 'panic|kernel'Opening a panic report in Console.app
If you prefer a GUI:
- Open Console (Applications → Utilities → Console, or Spotlight "Console").
- In the left sidebar under Reports, click Crash Reports (older macOS) or System Reports.
- Scroll for entries that begin with Kernel or contain panic in the name. Click one.
- The full report appears on the right. Use Cmd+F to jump to
panicString.
Console is convenient, but reading the raw file is often faster because you can search instantly and copy the whole thing.
The live unified log
The panic file is written at the moment of the crash. You can also pull panic-related messages from the unified log, which is helpful when you want to see what happened in the seconds before the reboot:
# Show panic-related messages from the last day
log show --predicate 'eventMessage contains "panic"' --last 1d
# Narrow to the kernel process and the last 6 hours, most useful right after a panic
log show --predicate 'process == "kernel"' --last 6h | grep -i panicThe unified log will not contain the full backtrace the way the .panic file does, but it gives you timing context — what the system was doing in the lead-up.
Anatomy of a panic report: an annotated example
This is the part that turns you from a guesser into a diagnostician. A panic report has a predictable structure. Here is a representative (sanitized, illustrative) Apple silicon panic string of the kind people see with high-refresh-rate display problems:
panic(cpu 4 caller 0xfffffff0291a7c40): userspace watchdog timeout:
no successful checkins from com.apple.WindowServer in 120 seconds
service: com.apple.logd, total successful checkins since load
(831 seconds ago): 83, last successful checkin: 0 seconds ago
service: com.apple.WindowServer, total successful checkins since
load (831 seconds ago): 8, last successful checkin: 120 seconds ago

Panic occurred in process WindowServer

Backtrace (CPU 4), panicked thread: 0xfffffff...
...
AppleH13CamIn ... AGXG16X ... IOMobileFramebuffer ...

Kernel Extensions in backtrace:
   com.apple.iokit.IOMobileFramebufferFamily
   com.apple.AGXG16X
Read it top to bottom:
panic(cpu 4 caller 0x...)— which CPU core panicked and the address of the code that called the panic. The hex addresses are not for you; the words after them are.userspace watchdog timeout: no successful checkins from com.apple.WindowServer in 120 seconds— this is thepanicString, the single most important line. It tells you why. Here, WindowServer (the display/compositing process) stopped responding to the watchdog, which forced a restart. A stuck WindowServer is classic for display/GPU trouble — frequently a too-high refresh rate.Panic occurred in process WindowServer— the "process in backtrace." This is the process that was on-CPU. WindowServer = graphics. A network daemon = networking/content filter.kernel_taskonly = often hardware or a deep driver fault.- Backtrace symbols — function names that were on the stack. Seeing
AGXG16X,IOMobileFramebuffer,AppleH13...points at the Apple GPU/display stack. Kernel Extensions in backtrace:— this is the smoking gun for third-party drivers. If you see something likecom.yourvpn.tunorcom.thirdparty.avhere, a kext is implicated. If you only seecom.apple.*extensions, the fault is in Apple's own code or driven by hardware/configuration rather than a third-party kext.
Other panicString patterns and what they usually mean:
Sleep Wake failure in EFIorPrevious Sleep Wake failure— a sleep/wake panic. Almost always a peripheral, hub, or external display that misbehaves during wake. (CAUSE 3 below.)Kernel data abort/DAR ...with a third-party kext in the backtrace — a driver dereferenced bad memory. Suspect that kext.KP / machine check,ECC, or panics with no third-party kext and inconsistent processes — leans toward hardware (RAM, thermals). (CAUSE 5.)watchdog timeout ... WindowServerrepeatedly, only when a specific monitor is connected — display/refresh-rate. (CAUSE 1.)
The single discipline that matters: read the panicString first, then check whether any non-Apple kext appears in "Kernel Extensions in backtrace." Those two data points route you to the right cause more than 80% of the time.
The Diagnostic Decision Tree
Use this flow every time. It keeps you from random reinstalls.
- Reproduce or note the pattern. Does the panic happen only when an external monitor is connected? Only on wake from sleep? Only when a specific app or VPN is running? Randomly with nothing in common? The pattern is half the diagnosis. Write it down.
- Read the latest panic report. Get the
panicStringand the "Kernel Extensions in backtrace" list (see above). - Is a third-party kext in the backtrace?
- Yes → go to CAUSE 2 (extensions). Identify the vendor, update or remove it, retest in Safe Mode.
- No → continue.
- Does
panicStringmention WindowServer / framebuffer / GPU, and does it only happen with a monitor attached? → CAUSE 1 (refresh rate). Drop the external display to 60 Hz first. - Does
panicStringmention Sleep Wake failure, or does it only happen on wake? → CAUSE 3 (sleep/wake + peripherals). Disconnect everything and test. - Are you on M5 MacBook Air / M5 Pro/Max, or using a content-filter/network extension, or saw a black screen after updating? → CAUSE 4 (Apple-acknowledged 26.5 items). Make sure you are fully updated.
- No third-party kext, no display/sleep pattern, panics are random and the report varies each time? → CAUSE 5 (hardware). Run Apple Diagnostics, check RAM/eGPU/thermals.
- Still unresolved after the above? → CAUSE 6 (corrupted system state): reset NVRAM, reset SMC (Intel), reinstall macOS in place.
Now the causes in detail.
CAUSE 1: High External Monitor Refresh Rate (120 / 144 / 240 Hz)
This is the standout Tahoe 26.5 issue and, happily, the one with the cleanest fix. A large share of "random restart" reports on Mac Studio and Mac mini turn out to be GPU/display watchdog panics triggered when a third-party high-refresh-rate display is driven at 120 Hz, 144 Hz, or 240 Hz. The panic report shows a WindowServer watchdog timeout with the Apple GPU/framebuffer stack (AGX..., IOMobileFramebuffer) in the backtrace, exactly like the annotated example above.
Why this happens
At high refresh rates the GPU driver and the display controller exchange timing, mode, and sync information far more aggressively than at 60 Hz. macOS point releases periodically change the display pipeline (HDR handling, variable refresh / ProMotion negotiation, dithering, multi-stream over DisplayPort/Thunderbolt). When a third-party monitor's firmware advertises a mode that the current driver does not negotiate cleanly — or when the cable/DSC link is marginal at 240 Hz — the GPU side can stall. WindowServer stops checking in, the watchdog fires at the 120-second mark, and the whole system restarts. It looks random because it depends on what is on screen, but it is tied to the display.
Tells that point at refresh rate:
- Panics never happen on the built-in display alone (laptops) or without the external monitor connected (Mac mini/Studio users who also have a small secondary screen can test).
- The
panicStringmentions WindowServer watchdog and the backtrace lists Apple GPU/framebuffer kexts only (no third-party kext). - It is worse during GPU-heavy work, video, HDR content, or wake from display sleep.
- A specific high-refresh monitor or cable is involved; swapping back to a 60 Hz screen makes it vanish.
The clean fix: drop the refresh rate
This is a strong, community-confirmed workaround. Lowering the refresh rate removes the marginal timing path entirely.
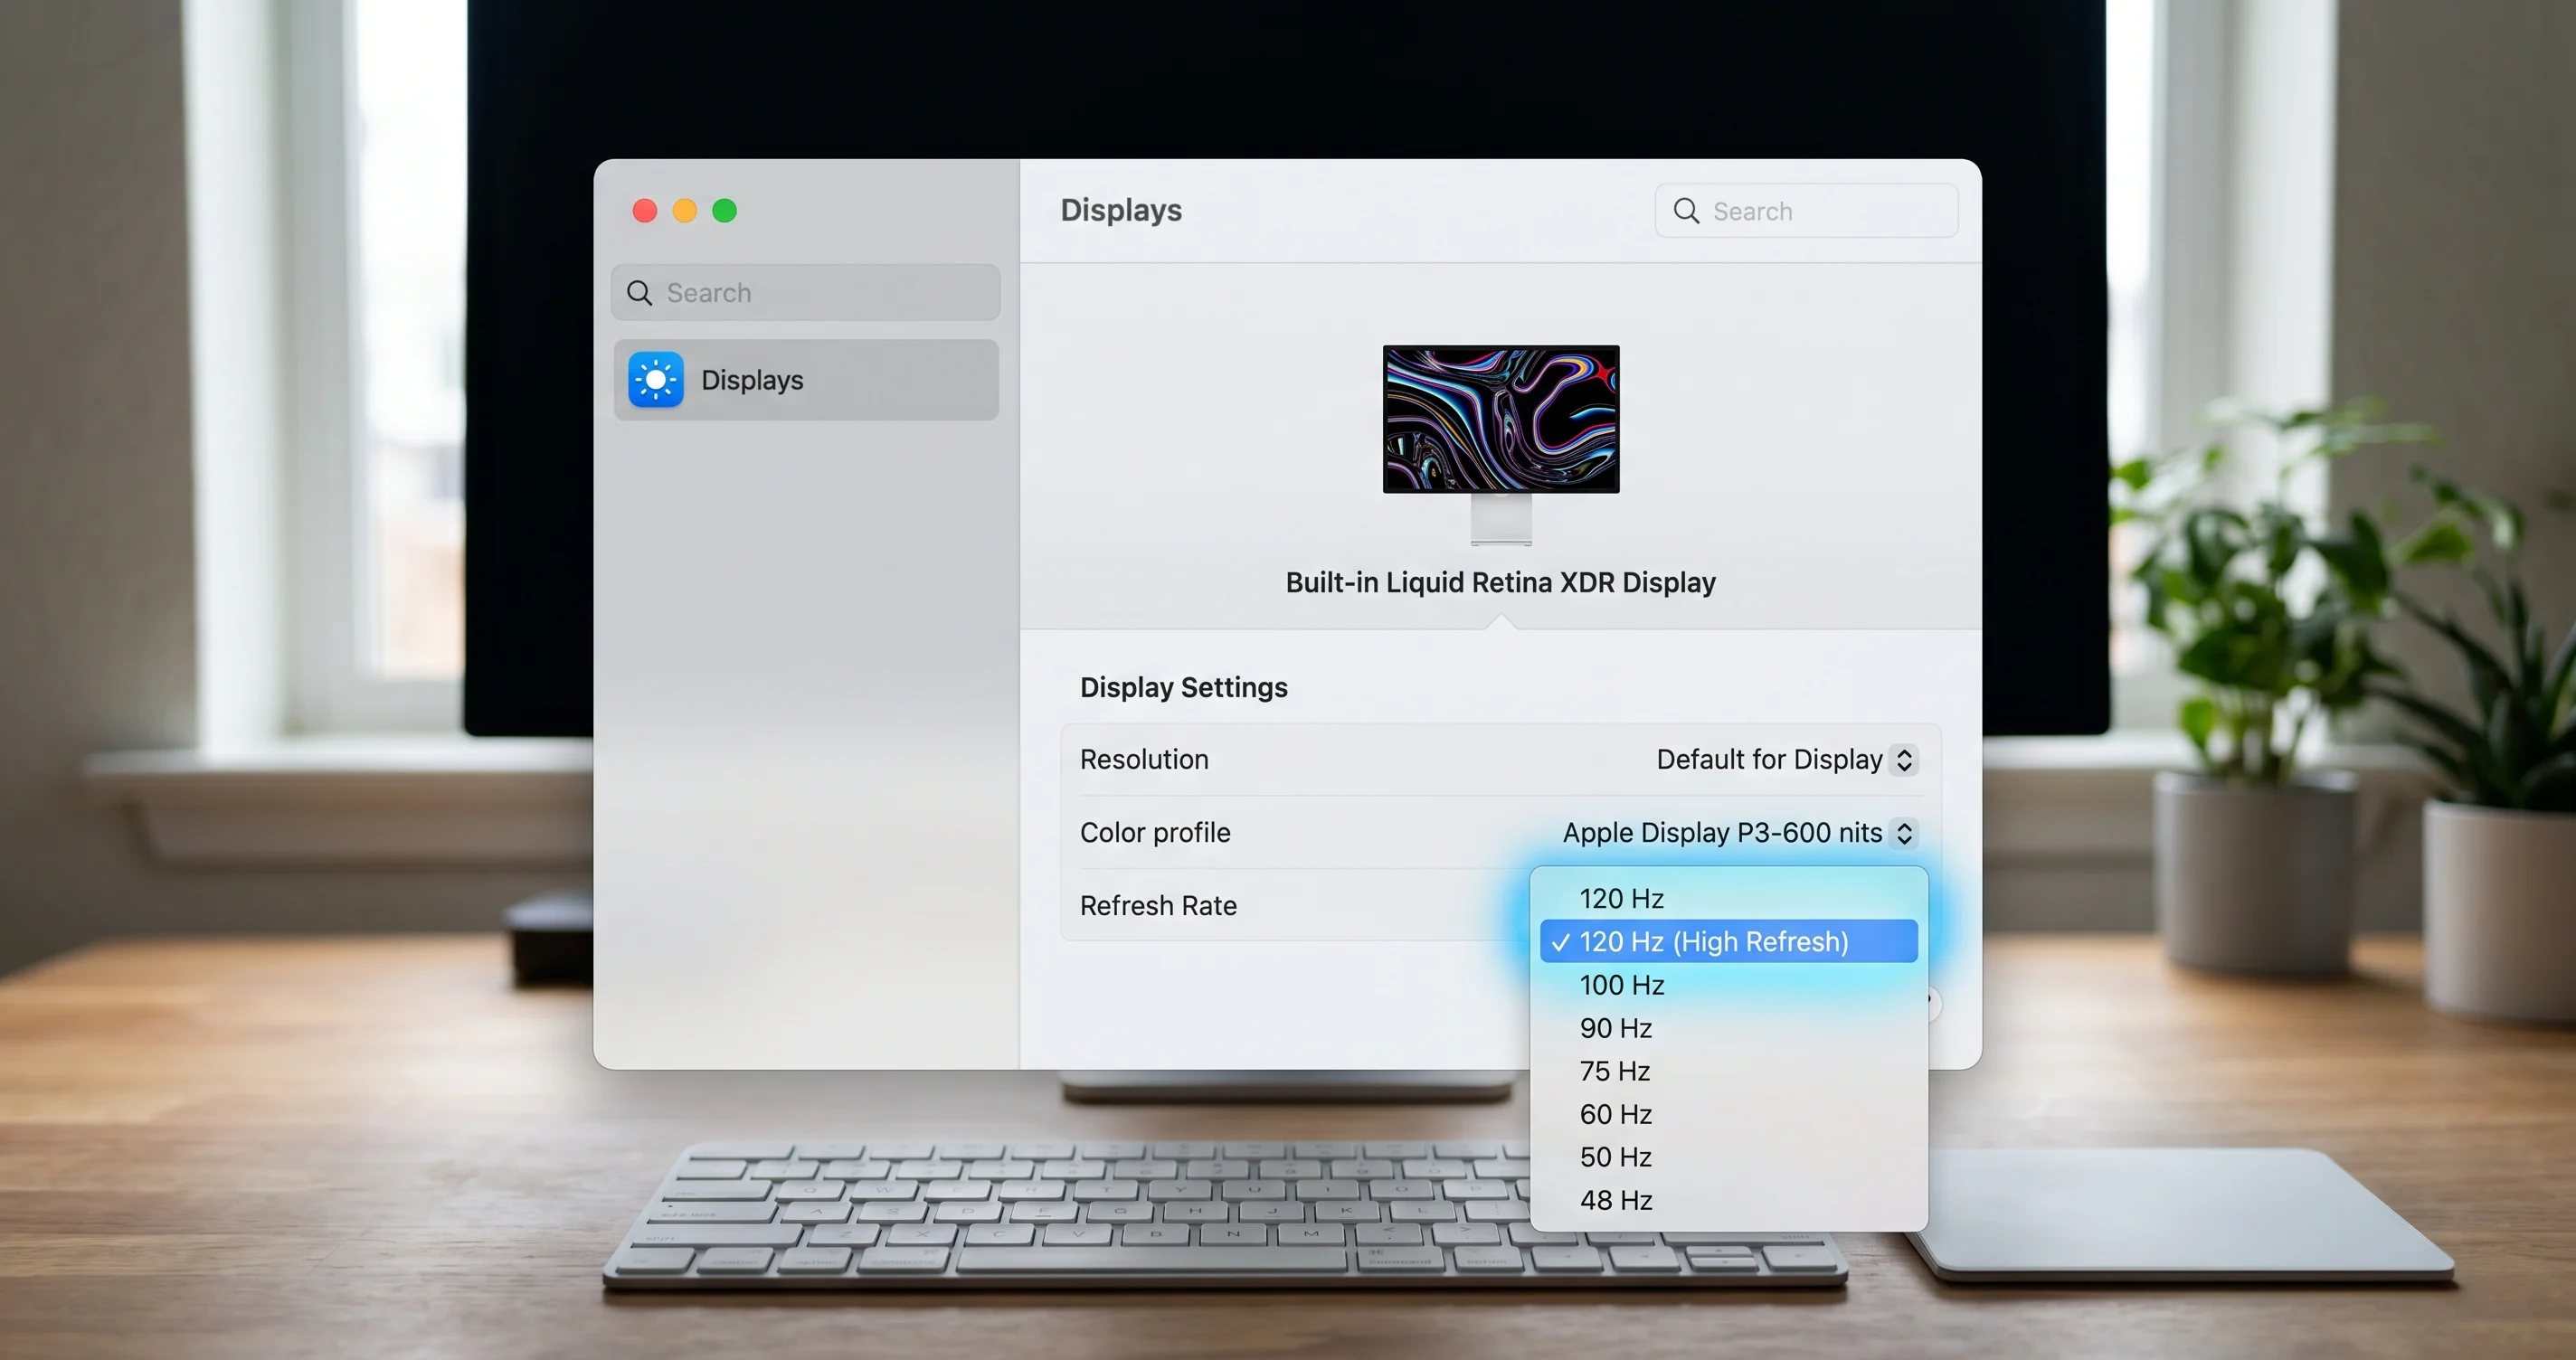
- Open System Settings → Displays.
- Select the external monitor.
- Find the Refresh Rate dropdown. Change 240 Hz → 120 Hz, or for stability, → 60 Hz.
- If you see a ProMotion / Variable refresh rate toggle, set it to a fixed rate rather than variable while testing.
- Use the display for a day. If the panics stop, the refresh rate was the cause.
If the macOS Displays panel does not expose the rate you want, or hides intermediate steps, SwitchResX (a long-standing third-party display utility) lets you set exact timings and lock a refresh rate. Set a clean 60 Hz or 120 Hz mode and save it as the default for that display.
Other levers that help with high-refresh stability:
- Use a certified cable. At 144/240 Hz you need a genuinely high-bandwidth DisplayPort or Thunderbolt 4 / USB4 cable. A marginal cable that "works" at 60 Hz will fail intermittently at 240 Hz. Swap the cable before blaming software.
- Connect directly, not through a dock, while testing. Docks and DisplayPort MST hubs add a negotiation layer that can be the weak link.
- Turn off HDR on the external display temporarily; the HDR pipeline adds timing complexity.
- Update the monitor's firmware if the manufacturer offers it. Display vendors do ship fixes for Mac negotiation bugs.
Because the fix is so clean, try this first whenever a panic only occurs with an external monitor attached. If lowering to 60 Hz stops the panics, you have your answer and can decide whether to stay at a safe rate, try 120 Hz, or wait for a future macOS/firmware update. For the broader set of external-display issues on Tahoe, see our external display not detected diagnostic guide.
CAUSE 2: Faulty or Outdated Kernel & System Extensions
If a third-party kext appears in "Kernel Extensions in backtrace," you have found your culprit category. The usual offenders on Tahoe are VPN clients, antivirus / endpoint-security agents, virtualization tools, audio interface drivers, and disk/RAID utilities — anything that installs a kernel extension (kext) or a system extension to hook deep into the OS.
Apple has been pushing developers from old kexts to user-space system extensions for years, and each macOS release tightens what legacy kexts can do. A kext built for an older system can dereference memory the way the new kernel does not expect, and the result is a Kernel data abort panic naming that kext.
Step 1: Inventory what is loaded
List the kernel extensions currently in memory:
# Show all loaded kernel extensions
kmutil showloaded
# Filter out Apple's own extensions to see only third-party ones
kmutil showloaded | grep -v com.appleAnything in that filtered list is a third-party driver running in your kernel right now. Cross-reference it against the bundle IDs in your panic report's "Kernel Extensions in backtrace" list — a match is your prime suspect.
Now list system extensions (the modern, user-space equivalent used by VPNs, content filters, and endpoint security):
# List installed system extensions and their state (activated/enabled)
systemextensionsctl list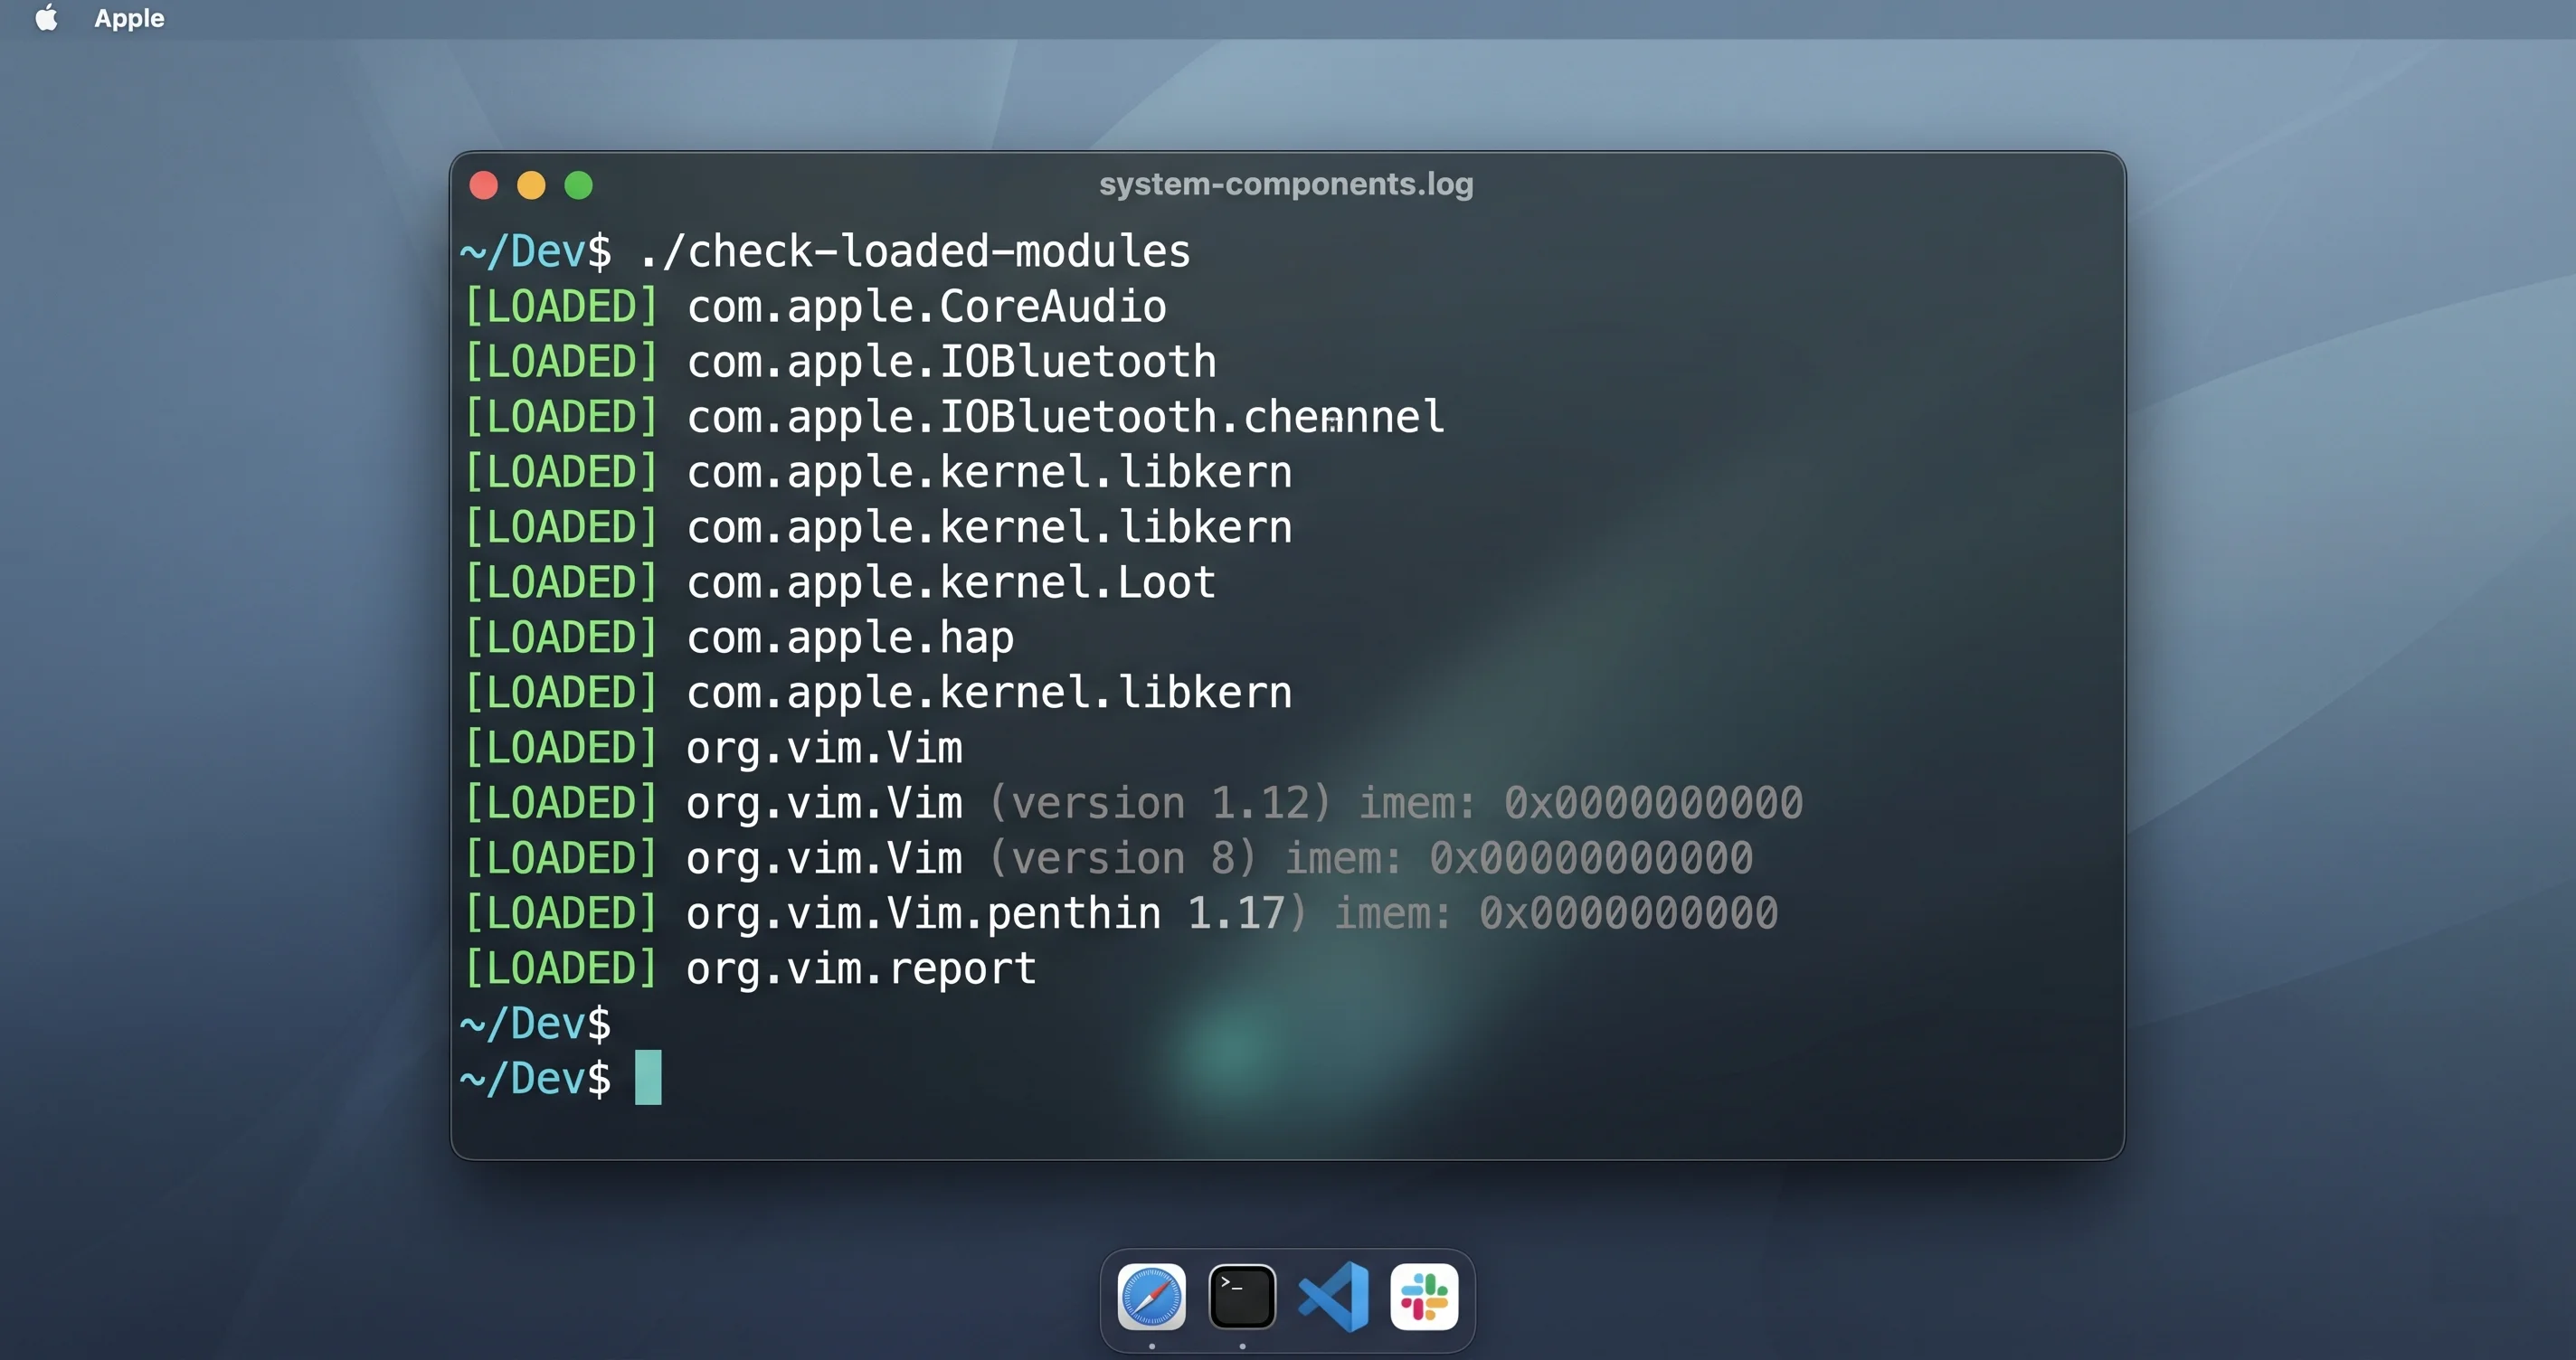
This shows each system extension, its team identifier, and whether it is activated enabled. VPNs and content filters install network extensions here — and as noted under CAUSE 4, content-filter network extensions were specifically called out in Apple's 26.5 restart fixes.
Step 2: Prove it with Safe Mode
Safe Mode boots macOS with third-party kexts and many startup items disabled. If the panics stop in Safe Mode, the cause is almost certainly something Safe Mode disabled — most likely a third-party extension.
Apple silicon (M1/M2/M3/M4/M5):
- Shut down fully.
- Press and hold the power button until "Loading startup options" appears.
- Select your startup disk, then hold Shift and click Continue in Safe Mode.
- Log in. You should see "Safe Boot" in the menu bar (look in the login window or System Settings).
Intel:
- Shut down.
- Power on and immediately hold Shift until the login window appears, then release.
Use the Mac in Safe Mode the way you normally trigger panics (connect the monitor, run the VPN's network — note that some network extensions will not load in Safe Mode, which is itself informative). No panics in Safe Mode → third-party software is the cause. Reboot normally to confirm they return.
Step 3: Remove or update the offending extension
Once you have a suspect:
- Update it first. The vendor may already ship a Tahoe-compatible build. Updating is less disruptive than removing.
- If updating does not help, uninstall it using the vendor's official uninstaller (not by dragging to Trash — kexts and system extensions need proper removal so they deregister cleanly).
- After removing a system extension you may need to re-approve or fully clear it in System Settings → Privacy & Security, where macOS lists extensions awaiting permission or pending removal. Approve the ones you trust; remove the ones you do not.
- Reboot and retest for a day.
Common categories to scrutinize, in rough order of how often they cause Tahoe panics: VPN clients (especially older tunnel kexts), antivirus/EDR agents, virtualization (older hypervisor kexts), audio interface drivers, and third-party disk/encryption utilities. If you run several, remove them one at a time so you learn which one was responsible rather than nuking your whole stack.
CAUSE 3: Sleep / Wake Panics with Peripherals and Hubs
If the panic happens on wake from sleep — you open the lid or wiggle the mouse, the screen flickers, and the machine restarts instead of waking — and especially if the panicString says "Sleep Wake failure," the trigger is almost always something attached to the Mac that does not negotiate the sleep/wake transition correctly. Thunderbolt docks, USB hubs, external drives, audio interfaces, card readers, and certain displays are the repeat offenders.
Confirm it is a sleep/wake panic
Two checks:
# Look at the sleep/wake history; "Failure" entries indicate wake problems
pmset -g log | grep -iE 'failure|wake|sleep' | tail -40
pmset -g log is the power-management event log. Look for Wake events followed by Failure, or for "Previous Sleep Wake failure" notes. Pair that with the panic report's timestamp — if the panic time lines up with a wake event, you have a sleep/wake panic.
# See what assertions and devices are involved in power transitions
pmset -g assertions
Fix it
- Disconnect everything and test the bare machine. Unplug all hubs, docks, drives, and non-essential peripherals. Let the Mac sleep and wake repeatedly for a day. If panics stop, a peripheral is the cause.
- Reconnect one device at a time, waiting a day between each, until the panic returns. The last one you added is the culprit.
- Power the hub/dock externally. Bus-powered hubs that draw from the Mac are a frequent wake-panic source. A self-powered (mains-powered) hub often resolves it.
- Update the dock/hub firmware and the Mac to the latest 26.5 build. Thunderbolt firmware fixes are real.
- Try a different port or a direct connection. Move the problem device off a daisy-chain.
- As a workaround, adjust sleep behavior while you isolate the device — for example, prevent the display from sleeping the disks, or use
pmsetto tune wake-on-network if a network device is waking the Mac into a bad state. Do this only to buy time; the real fix is identifying the peripheral.
Sleep/wake panics are tedious to diagnose precisely because they require waiting between tests, but the disconnect-and-add-back method is reliable. Resist the urge to reinstall macOS for a sleep/wake panic — it is a peripheral negotiation problem far more often than an OS corruption problem.
CAUSE 4: The Apple-Acknowledged 26.5 Hardware & Enterprise Items
macOS Tahoe 26.5, released on 2026-05-11, included stability fixes that Apple documented in its enterprise release notes. Knowing these helps you separate "already fixed if I update" from "still open, needs a workaround."
What Apple acknowledged and addressed in 26.5:
- Restart issues on M5 MacBook Air and M5 Pro / Max models. Apple shipped fixes for unexpected restarts affecting these newer Apple silicon machines. If you are on one of these and were panicking on an earlier build, making sure you are on the full 26.5 release (or later) is step one.
- Content-filter network extension restarts. Restarts tied to content-filter network extensions — common in managed/enterprise environments and in some consumer VPN/parental-control tools — were addressed. This overlaps with CAUSE 2: if your
systemextensionsctl listshows a content-filter network extension and you are panicking, update both macOS and that extension's vendor app. - Black screen after update. A condition where some Macs showed a black screen after updating was addressed.
The honest framing: Apple fixing a class of restarts does not mean every instance is gone. Some users on affected hardware, or running particular extensions, continue to report restarts after updating — those are community-reported and handled with the workarounds in this guide (full update, drop refresh rate, audit extensions, isolate peripherals), not with a guaranteed Apple patch. So:
- Update fully. System Settings → General → Software Update. Install 26.5 completely (and any 26.5.x supplemental that follows).
- Then re-test. A meaningful share of panics on M5 hardware and content-filter setups simply disappear after the full update.
- If they persist, treat the panic report as the source of truth and route to CAUSE 1/2/3/5 based on what it says.
For the full picture of what shipped in this release, including the security fixes, see our macOS Tahoe 26.5 complete update guide. If you arrived here from an earlier release, the patterns in our 26.3 bugs and crashes fix guide and the 26.2 troubleshooting guide provide useful historical context on how these stability issues have evolved across the Tahoe cycle.
CAUSE 5: Hardware — RAM, eGPU / Thunderbolt, and Thermals
When the panic reports vary every time, name no third-party kext, show no display/sleep pattern, and survive a clean reinstall, you are likely looking at hardware. Hardware panics tend to be inconsistent precisely because they depend on physical conditions — temperature, a marginal memory cell, a flaky connector.
Run Apple Diagnostics
Apple's built-in hardware test is the first move:
Apple silicon:
- Shut down.
- Press and hold the power button until "Loading startup options" appears, then release.
- Press Cmd+D to run Diagnostics.
Intel:
- Shut down.
- Power on and immediately hold the
Dkey (or Option+D to test over the internet) until a progress bar or language picker appears.
Diagnostics runs and returns reference codes. Codes beginning with PPM relate to power; PPT to the battery; NDC/VFD to camera/display; and several memory-related codes point at RAM. Note any code it gives you — it is the language Apple support will speak.
RAM (Intel / Mac Pro with user-upgradable memory)
On machines where you can change RAM:
- If you recently added third-party RAM and panics started, reseat or remove it. Bad or incompatible memory is a classic panic source.
- Test with one stick / one bank at a time to isolate a failing module.
- Apple silicon Macs have soldered, unified memory — you cannot swap it, so a confirmed memory fault there means a service visit.
eGPU and Thunderbolt
- External GPUs (mostly Intel-era setups) add a complex driver and power path. If you run an eGPU and see GPU-stack panics, disconnect it and test. eGPU driver support has narrowed over recent macOS releases.
- Marginal Thunderbolt links — a bad cable, an overloaded bus — can produce panics that look random. Simplify the Thunderbolt chain and use known-good cables (this overlaps with CAUSE 3).
Thermals
- A Mac that panics under sustained heavy load (long renders, gaming, compiling) and runs hot may be hitting a thermal-related fault. Ensure vents are clear, the machine is on a hard surface, and ambient temperature is reasonable.
- Repeated thermal panics on a machine with aging thermal paste or a failing fan are a service item.
If a panic only happens when your Mac is also slow and overheating under load, the fix a slow Mac guide covers reducing background load and managing resource pressure, which can lower the thermal ceiling you are hitting.
CAUSE 6: Corrupted System State — NVRAM, SMC, and Reinstall in Place
When you have ruled out displays, extensions, peripherals, and hardware, the last category is corrupted low-level state or a damaged macOS install.
Reset NVRAM (mostly Intel)
NVRAM/PRAM stores small settings — display, startup disk, some power values. On Intel Macs, resetting it can clear a corrupted value causing panics. There are two paths:
# From a logged-in Intel Mac, clear NVRAM, then reboot
sudo nvram -c
Or at boot on Intel: shut down, power on, and immediately hold Option+Cmd+P+R for about 20 seconds, then release. Apple silicon Macs manage NVRAM automatically and do not have a manual key-combo reset — a normal restart resets the relevant state, so the key combo does not apply.
Reset SMC (Intel only)
The System Management Controller handles power, thermal, and some hardware behavior on Intel Macs. A corrupted SMC state can cause power and wake-related panics. The exact key sequence depends on the model (T2 vs. non-T2, desktop vs. laptop) — follow Apple's model-specific SMC reset steps. Apple silicon Macs have no SMC to reset; a full shutdown (leave it off ~30 seconds) and restart accomplishes the equivalent.
Reinstall macOS in place
If panics persist with no clear cause, reinstalling macOS over your existing system replaces system files without erasing your data:
- Back up first with Time Machine (always, before any reinstall).
- Boot to Recovery: on Apple silicon, hold the power button until "Loading startup options," then choose Options → Continue; on Intel, hold Cmd+R at boot.
- Choose Reinstall macOS Tahoe and follow the prompts. This is an in-place reinstall — your files, apps, and settings remain.
- If panics still occur after a clean reinstall on factory-clean state, the evidence strongly points back to hardware (CAUSE 5) or a single re-installed extension (CAUSE 2) — at which point a Genius Bar visit is warranted.
A reinstall is a heavy step. Do not jump to it first; reach it only after the panic report and the decision tree have failed to pin a cause.
When to Take It to Apple
Some panics are not yours to fix. Take the Mac to Apple (or an Apple Authorized Service Provider) when:
- Apple Diagnostics returns a hardware reference code. That is a confirmed component issue.
- Panics persist after a clean in-place reinstall on an otherwise stock configuration — software has been ruled out.
- The panic report consistently names a hardware fault (machine check, ECC/memory errors) with no third-party kext.
- You are on M5 MacBook Air / M5 Pro/Max, fully updated to 26.5 or later, and still panicking — Apple acknowledged restart issues on these models, so your case is relevant data for them and may be covered.
- The Mac will not stay booted long enough to diagnose (panic loop) even after the recovery steps below.
Before you go, collect the evidence: copy the most recent panic reports from /Library/Logs/DiagnosticReports/, note your Apple Diagnostics code, and write down the pattern (when it happens, what is connected). A clear report and a reproducible pattern dramatically speed up a support visit. Apple silicon Macs are still under warranty for the M5 generation, and acknowledged restart issues are exactly the kind of thing service teams want to see documented.
Troubleshooting Common Issues
Problem: My Mac only panics when it wakes from sleep
Solution: This is a sleep/wake panic, almost always caused by a peripheral. Run pmset -g log | grep -iE 'failure|wake' to confirm wake failures line up with the panic times. Disconnect every hub, dock, and external drive, then let the Mac sleep and wake repeatedly for a day. If it is stable, reconnect devices one at a time until the panic returns — that device (or its cable/hub power) is the cause. Power your hub externally and update its firmware; bus-powered hubs are the most common trigger.
Problem: My Mac only panics when my external monitor is connected
Solution: This is a display/GPU panic, and the fix is usually clean. Open System Settings → Displays, select the external monitor, and drop the Refresh Rate from 240/144/120 Hz down to 60 Hz. Use it for a day. If the panics stop, the high refresh rate was the cause — you can then try stepping up to 120 Hz, switch to a certified high-bandwidth cable, connect directly instead of through a dock, and disable HDR. SwitchResX can lock an exact safe mode if the Displays panel hides the rate you need.
Problem: My Mac panics randomly with no obvious pattern
Solution: Let the panic report decide. Open the newest file in /Library/Logs/DiagnosticReports/, read the panicString, and check "Kernel Extensions in backtrace." A third-party kext there → update or remove that software and test in Safe Mode. No third-party kext and the reports differ every time → run Apple Diagnostics (Cmd+D at boot on Apple silicon) for a hardware code. Random panics are usually either one misbehaving extension or marginal hardware — the report tells you which.
Problem: My Mac is stuck in a panic loop and won't finish booting
Solution: Boot into Safe Mode first (Apple silicon: hold power → select disk → hold Shift → Continue in Safe Mode; Intel: hold Shift at boot). Safe Mode disables third-party extensions, so if it boots cleanly, a kext is the cause — remove it from there. If Safe Mode also loops, boot to Recovery (Apple silicon: hold power → Options; Intel: Cmd+R), run Disk Utility First Aid, and if needed reinstall macOS in place. Persistent looping even from a clean reinstall points at hardware — take it to Apple.
Frequently Asked Questions
Is a kernel panic the same as my Mac crashing?
Not quite. A kernel panic is the entire system halting and restarting because the OS core hit an unsafe state — you get a "Your computer restarted because of a problem" dialog. An app crash is a single program quitting while the rest of macOS keeps running. They write different reports and have different fixes, so identify which one you are seeing before troubleshooting.
Where exactly is the panic log stored on macOS Tahoe?
Kernel panic reports live in /Library/Logs/DiagnosticReports/, named like Kernel-2026-05-22-143012.panic or a richer panic-full-...ips file on Apple silicon. You can also open them in Console.app under Crash Reports / System Reports. Run ls -lt /Library/Logs/DiagnosticReports/ | grep -i panic in Terminal to list them newest-first.
Will dropping my monitor's refresh rate really stop the restarts?
If your panics only happen with that monitor connected and the report shows a WindowServer/GPU watchdog timeout, then yes — dropping from 240/144/120 Hz to 60 Hz is a strong, community-confirmed workaround that removes the marginal timing path. It is the first thing to try for display-related panics. You can later test 120 Hz with a certified cable once the system is stable.
Did Apple fix the restart bugs in macOS Tahoe 26.5?
Apple's 26.5 enterprise release notes acknowledged and addressed restart fixes for M5 MacBook Air and M5 Pro/Max, content-filter network extension restarts, and a black-screen-after-update condition. That covers a meaningful set of cases, so update fully first. But some users still report panics afterward — those are community-reported and need the workarounds in this guide rather than a guaranteed patch.
How do I know if a third-party driver caused my panic?
Open the panic report and find the "Kernel Extensions in backtrace" section. If you see bundle IDs that are not com.apple.* — a VPN, antivirus, or virtualization vendor's name — that extension is implicated. Confirm by booting Safe Mode (which disables third-party kexts): if the panics stop, third-party software is the cause. Then update or uninstall that extension.
Should I reinstall macOS to fix kernel panics?
Reinstalling is a last resort, not a first step. Work the decision tree first — refresh rate, extensions, peripherals, the acknowledged 26.5 items, hardware. Only after those fail should you do an in-place reinstall (which keeps your data). Always back up with Time Machine first. If panics continue even after a clean reinstall, the cause is almost certainly hardware, and it is time for Apple.
Conclusion
Kernel panics feel catastrophic, but on macOS Tahoe 26.5 they are usually traceable to a short list of causes — and the panic report tells you which one. Read the panicString and the "Kernel Extensions in backtrace" list first; those two fields route most panics to the right fix. For the single most common Tahoe 26.5 trigger, a too-high external display refresh rate, the fix is as simple as dropping to 60 Hz. For extension-related panics, audit with kmutil showloaded and systemextensionsctl list, then prove it in Safe Mode. For sleep/wake panics, isolate the peripheral. Make sure you are fully updated so the items Apple acknowledged in 26.5 are already handled, and reserve hardware tests and reinstalls for when the report and the decision tree have genuinely failed to pin a cause.
Diagnose, do not guess — and you will resolve the vast majority of these restarts yourself. For related reading, see our macOS Tahoe 26.5 update and security guide, the external display diagnostic guide, and the Safari tab crashes fix if your problem turns out to be app-level rather than a full kernel panic.