macOS Tahoe Electron Apps Performance Complete Guide 2025: Fixing VSCode, Slack, Discord, and Development Tools Slowdown

Comprehensive guide to fixing macOS Tahoe 26 Electron app performance issues affecting VSCode, Slack, Discord, and other development tools. Learn about the WindowServer GPU bug, official fixes, optimization strategies, and alternative solutions with detailed troubleshooting steps.
If you've upgraded to macOS Tahoe 26 and noticed your Mac suddenly struggling with apps like VSCode, Slack, Discord, or other development tools, you're not alone. A critical Electron performance bug has been affecting millions of developers and professionals worldwide, causing system-wide lag, GPU spikes up to 90%, excessive battery drain, and fan noise that turns your MacBook into a jet engine.
This comprehensive guide explains the technical root cause, identifies affected applications, provides step-by-step fixes, and offers optimization strategies to restore your Mac's performance to pre-Tahoe levels.
Executive Summary: The Electron Performance Crisis on macOS Tahoe
What Happened?
On September 15, 2025, Apple released macOS 26 "Tahoe" with significant system improvements including the revolutionary Liquid Glass UI design. However, users immediately began reporting severe performance degradation when running Electron-based applications—the framework powering popular tools like Visual Studio Code, Slack, Discord, Notion, and dozens of other productivity apps.
Key Facts:
- The Bug: Electron's override of a private macOS API (
_cornerMask) caused WindowServer to repeatedly recalculate window shadows, resulting in 80-90% GPU usage - Impact: System-wide lag, stuttering, high CPU/GPU usage, battery drain, and excessive heat generation
- Affected Devices: All Macs running macOS Tahoe 26, including Apple Silicon (M1-M4) and Intel-based systems
- The Fix: Released October 2, 2025, in Electron versions 36.9.2, 37.6.0, 38.2.0, and 39.0.0-alpha.7
- Current Status: Only 9 of 37 tracked apps have updated as of October 2025, with 28 still pending fixes
Performance Impact Overview
Typical User Experience:
- WindowServer GPU Usage: 80-90% (normal: 5-15%)
- System Responsiveness: Severe lag when moving windows, scrolling, or switching apps
- Battery Life: 30-50% reduction during typical usage
- Fan Noise: MacBook Pro fans running at maximum speed continuously
- Thermal Impact: Significant heat generation even during light tasks

The Technical Root Cause: Understanding the Electron WindowServer Bug
How Electron Works on macOS
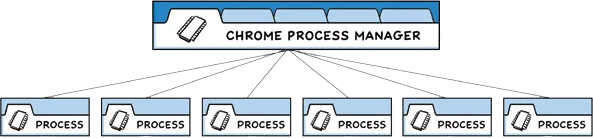
Electron is a framework that allows developers to build cross-platform desktop applications using web technologies (HTML, CSS, JavaScript). Popular apps like VSCode, Slack, Discord, and Notion all run on Electron, making it one of the most widely-used development frameworks in the world.
To integrate with macOS's native UI, Electron uses AppKit APIs to render windows with proper shadows, transparency effects, and corner rounding. This is where the problem began.
The Private API Override
For years, Electron had been overriding a private AppKit API method called _cornerMask to apply custom corner masks to vibrant views (transparent UI elements). This "dirty hack" was implemented to fix what developers called "an ancient issue with corner smoothing."
The Code Problem:
// Electron's problematic override
@implementation NSVisualEffectView (CustomCornerMask)
- (id)_cornerMask {
  // Custom implementation that forced WindowServer
  // to recalculate shadows on every frame
  return customMask;
}
@end
This override worked perfectly fine on macOS 15 Sequoia and earlier versions. However, it relied on undocumented behavior that Apple never guaranteed would remain stable.
What Changed in macOS Tahoe 26
macOS Tahoe 26 introduced significant optimizations to WindowServer's shadow rendering system. According to the engineer who diagnosed the issue:
"AppKit uses method implementation identity to decide whether the window mask is static. When Electron overrides
_cornerMask, WindowServer can no longer memoize (cache) the shadow calculation. Instead, it must recalculate and repaint window shadows on every single frame."
The Performance Penalty:
- Every Window Movement: Shadow recalculation triggered
- Every Scroll Event: GPU forced to repaint shadows
- Multiple Electron Apps: Cumulative performance degradation
- WindowServer Overload: 80-90% GPU usage became the norm
The Official Fix (October 2, 2025)
Electron maintainers released a fix by completely removing the _cornerMask override and allowing AppKit to handle corner masking natively through NSVisualEffectView.
GitHub PR #48376: "fix: macOS 26 Tahoe - stop overriding private cornerMask API"
Fixed Versions:
- Electron v39.0.0-alpha.7
- Electron v38.2.0
- Electron v37.6.0
- Electron v36.9.2
Important: The fix requires individual app developers to update their applications with the new Electron versions. Simply updating macOS won't solve the problem—you need app updates.
Affected Applications: Comprehensive List and Fix Status
Major Electron Apps Experiencing Performance Issues
Electron powers hundreds of popular applications. Here are the most commonly used apps affected by this bug:
Development Tools:
- Visual Studio Code - Microsoft's flagship code editor
- Cursor - AI-powered code editor
- GitHub Desktop - Git client
- Postman - API development platform
- Theia IDE - Cloud-based IDE
- pgAdmin - PostgreSQL management tool
Communication & Collaboration: 7. Slack - Business messaging platform 8. Discord - Communication platform for gamers and communities 9. Microsoft Teams - Enterprise collaboration tool 10. Signal - Encrypted messaging app 11. Zoom - Video conferencing (partially Electron)
Productivity Apps: 12. Notion - Note-taking and knowledge management 13. Obsidian - Markdown-based knowledge base 14. Evernote - Note-taking application 15. Todoist - Task management app
Password Managers & Security: 16. 1Password - Password manager (desktop app) 17. Bitwarden - Open-source password manager
Other Popular Apps: 18. Spotify - Music streaming (desktop client) 19. Figma - Design tool (partially Electron) 20. MongoDB Compass - Database management 21. Podman Desktop - Container management 22. Docker Desktop - Container platform UI

Fix Status Tracking (October 2025)
Thanks to the community-maintained website shamelectron.com, we can track which apps have implemented the fix.
✅ Fixed Apps (9 total):
- Discord
- Figma
- MongoDB Compass
- Obsidian
- Pocket Casts
- Signal
- Slack
- Visual Studio Code (Insiders build)
- Cluely
⏳ Still Awaiting Updates (28+ apps):
- Visual Studio Code (Stable)
- Cursor
- Notion
- GitHub Desktop
- 1Password
- Bitwarden
- Spotify Desktop
- Microsoft Teams
- And many more...
How to Check Your Apps: Visit shamelectron.com for real-time status updates (refreshes every 12 hours).
Symptoms and Diagnosis: Is Your Mac Affected?
Common Performance Symptoms
System-Level Issues:
- Stuttery Window Movement: Dragging windows feels laggy and unresponsive
- Scrolling Lag: Both in-app scrolling and system-wide scrolling stutters
- Input Delay: Noticeable delay between typing and characters appearing
- Beach Ball Cursor: Spinning beach ball appearing during routine tasks
- Fan Noise: MacBook Pro fans ramping up to maximum speed
- Battery Drain: Significant reduction in battery life (30-50% shorter)
- Heat Generation: Mac becoming uncomfortably hot during light usage
Application-Specific Symptoms:
- VSCode: Slow project loading, laggy autocomplete, delayed syntax highlighting
- Slack: Message loading delays, channel switching lag, workspace performance issues
- Discord: Voice chat stuttering, video call performance degradation, UI freezes
- Notion: Slow page loading, delayed typing response, database query lag
Diagnostic Steps with Activity Monitor
Step 1: Open Activity Monitor
Applications → Utilities → Activity Monitor
Or: Cmd + Space, type "Activity Monitor"
Step 2: Check GPU Usage
- Click the Window menu → GPU History
- Launch an Electron app (VSCode, Slack, Discord)
- Observe GPU usage spike
What to Look For:
- Normal: 5-15% GPU usage with Electron apps open
- Bug Present: 80-90% GPU usage, especially from WindowServer process
Step 3: Identify WindowServer CPU Usage
- Click CPU tab
- Sort by % CPU (click column header)
- Look for WindowServer process
What to Look For:
- Normal: 2-5% CPU usage
- Bug Present: 20-40% CPU usage continuously
Step 4: Check Memory Pressure
- Click Memory tab
- Check the Memory Pressure graph at bottom
What to Look For:
- Green: System performing well
- Yellow: Performance degradation likely
- Red: Severe performance issues, consider closing apps
User Testimonials and Real-World Reports
From GitHub Issue #48311 (Original Bug Report):
ToxicLand (M1 Max MacBook Pro):
"Having Electron-based apps like Discord and VS Code open causes huge lag across the entire system. Moving windows and scrolling becomes stuttery. CPU and GPU usage remain low in Activity Monitor, but the system feels like it's crawling. This started immediately after upgrading to macOS 26 RC—macOS 15 Sequoia didn't have this issue at all."
pztrn (Developer):
"I tested multiple Electron apps: Ferdium, Bitwarden, VSCode, SiYuan, DeltaChat. Every single one spikes GPU usage from 0% to 25% the moment the app launches. The UI becomes visibly laggy when multiple apps are open simultaneously. Interestingly, minimizing the apps drops GPU usage to near-zero immediately."
avarayr (Cursor IDE User):
"Cursor IDE (Electron-based) spikes GPU usage to 100% and causes my MacBook Pro fans to run at maximum speed. This makes the machine unusable for development work. I've had to switch back to Sequoia until this is fixed."
From VSCode GitHub Issue #267022:
"After updating to macOS 26, I encountered significant GPU usage spikes whenever opening projects in VS Code. The WindowServer process consistently shows around 90% GPU usage according to Activity Monitor. My 2019 16-inch MacBook Pro's fans are constantly running at full speed."
Affected Hardware Configurations
Apple Silicon Macs:
- MacBook Air (M1, M2, M3, M4)
- MacBook Pro (M1, M1 Pro, M1 Max, M2, M2 Pro, M2 Max, M3, M3 Pro, M3 Max, M4, M4 Pro, M4 Max)
- Mac Studio (M1 Max, M1 Ultra, M2 Max, M2 Ultra)
- Mac mini (M1, M2, M4, M4 Pro)
- iMac (M1, M3, M4)
Intel Macs (Final macOS Tahoe Support):
- Mac Pro (2019)
- MacBook Pro 16-inch (2019)
- MacBook Pro 13-inch (2020)
- iMac 27-inch (2020)
Note: Intel Macs experience even more severe performance degradation due to less efficient integrated graphics compared to Apple Silicon's unified memory architecture.
Complete Fix Solutions: Step-by-Step Remediation Guide
Method 1: Update Your Applications (Recommended)
This is the permanent, official solution that addresses the root cause.
Step 1: Check App Update Status
Visit shamelectron.com to see if your apps have been updated.
Step 2: Update Fixed Apps
For App Store Apps:
- Open App Store
- Click Updates tab
- Update all available apps
- Restart the app after updating
For Direct Download Apps:
Visual Studio Code:
# Check current version
code --version

# Update via Homebrew
brew upgrade --cask visual-studio-code

# Or download latest from: https://code.visualstudio.com/
Slack:
- Slack → Check for Updates
- Or download from: https://slack.com/downloads/mac
Discord:
- Discord → Check for Updates
- Or download from: https://discord.com/download
Obsidian:
- Settings → About → Check for updates
- Or download from: https://obsidian.md/download
Step 3: Verify Fix Implementation
After updating:
- Open Activity Monitor
- Launch the updated app
- Check WindowServer GPU usage
- Expected: GPU usage should be 5-15% (normal range)
Method 2: Temporary Workarounds (While Waiting for Updates)
If your critical apps haven't been updated yet, these workarounds can significantly improve performance.
Workaround 1: Disable Window Shadows (VSCode Specific)
Microsoft VSCode team implemented a temporary fix by disabling shadows on Darwin 26.x:
# Launch VSCode with shadows disabled
CHROME_HEADLESS=1 code

# Or set permanently in your shell profile
echo 'export CHROME_HEADLESS=1' >> ~/.zshrc
source ~/.zshrcLimitations:
- Only works for Chromium/Electron apps that respect this flag
- Removes window shadows (aesthetic impact)
- Must be set each session unless added to shell profile
Workaround 2: Minimize Unused Apps
The bug only affects apps in the foreground or visible in the background.
Immediate Relief:
- Minimize (⌘ + M) Electron apps when not actively using them
- GPU usage drops to near-zero when minimized
- Use ⌘ + Tab to switch between apps efficiently
Workaround 3: Use Full-Screen Mode
Full-screen mode changes how macOS renders windows, often bypassing the shadow calculation issue.
How to Enable:
- Click green button in app window's top-left corner
- Or use: ⌃ Control + ⌘ Command + F
- GPU usage often returns to normal in full-screen mode
Workaround 4: Reduce Transparency (Intel Macs)
This system-level setting reduces GPU workload significantly on Intel Macs.
Steps:
- System Settings → Accessibility → Display
- Enable "Reduce transparency"
- Restart affected applications
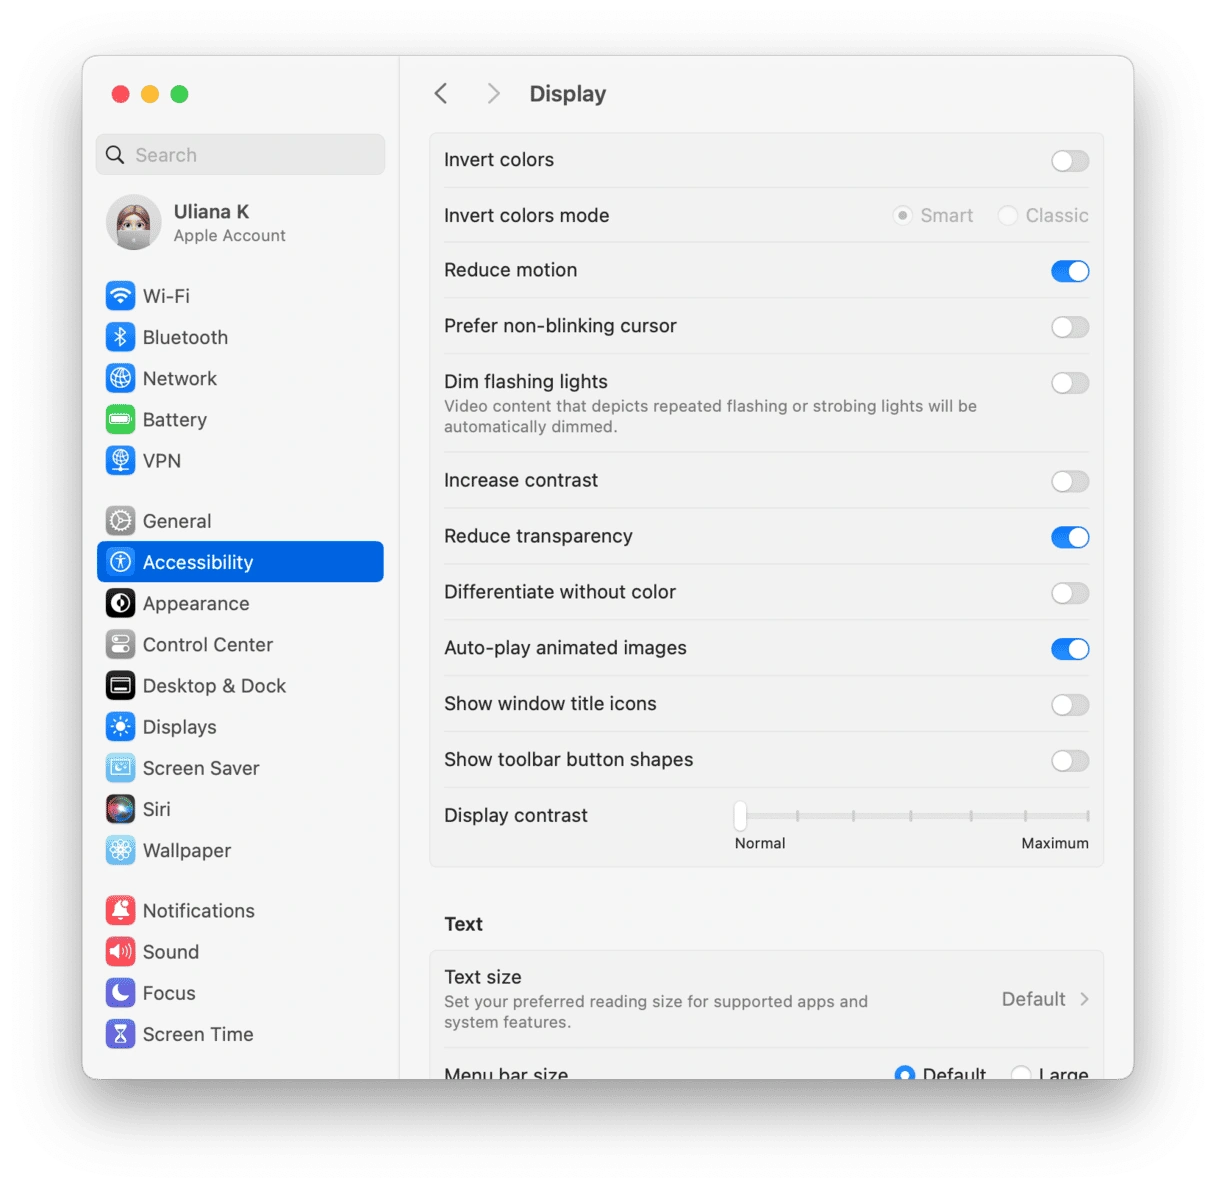
Impact:
- Intel Macs: 20-30% GPU usage reduction
- Apple Silicon: 5-10% GPU usage reduction
- Trade-off: Liquid Glass UI effects disabled
Method 3: Use Alternative Native Apps
While waiting for fixes, consider switching to native Mac apps for critical workflows.
Development Editors:
- Zed - Rust-based, blazing fast, native Mac app
- Nova - Panic's native Mac code editor
- BBEdit - Classic Mac text editor, extremely efficient
- Xcode - For Swift/iOS development, fully native
Communication Apps:
- Safari - For web versions of Slack/Discord (better performance than Electron)
- Messages - Native iMessage/SMS integration
- FaceTime - Video conferencing alternative to Zoom/Teams
Note-Taking:
- Apple Notes - Native, iCloud sync, excellent performance
- Bear - Native Mac/iOS note-taking app
- Craft - Native document editor with databases
Method 4: Downgrade to macOS Sequoia (Last Resort)
⚠️ Warning: Only consider this if your work is completely blocked.
Before Downgrading:
- Full Time Machine Backup: Essential for data safety
- Export Critical Data: Ensure all important files backed up
- Document Installed Apps: List apps to reinstall
Downgrade Process:
- Create bootable macOS Sequoia USB installer
- Restart Mac and hold Option key
- Boot from USB installer
- Erase and reinstall macOS Sequoia
- Restore from Time Machine backup (pre-Tahoe)
Alternative: Use a separate APFS volume to dual-boot Sequoia and Tahoe.
Development Tools Optimization: Beyond the Electron Fix
Even after applying fixes, optimizing your development environment ensures maximum performance on macOS Tahoe.
Visual Studio Code Performance Optimization
Essential settings.json Configuration:
{
  // Disable resource-intensive visual features
  "editor.minimap.enabled": false,
  "editor.smoothScrolling": false,
  "editor.cursorBlinking": "solid",
  "editor.cursorSmoothCaretAnimation": "off",

  // Optimize rendering
  "editor.renderWhitespace": "selection",
  "editor.renderControlCharacters": false,
  "editor.renderIndentGuides": false,

  // Reduce file watching overhead
  "files.watcherExclude": {
    "**/.git/objects/**": true,
    "**/.git/subtree-cache/**": true,
    "**/node_modules/*/**": true,
    "**/.hg/store/**": true,
    "**/bower_components/**": true
  },

  // Disable telemetry
  "telemetry.telemetryLevel": "off",

  // Extension performance
  "extensions.autoUpdate": false,
  "extensions.autoCheckUpdates": false,

  // Search optimization
  "search.followSymlinks": false,
  "search.exclude": {
    "**/node_modules": true,
    "**/dist": true,
    "**/build": true
  }
}
Extension Management Best Practices:
-
Audit Extensions Regularly
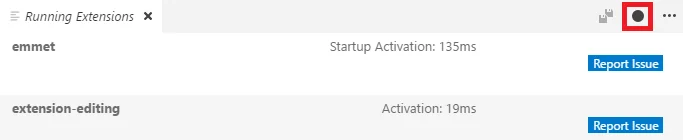
Command Palette (⌘⇧P) → Developer: Show Running Extensions- Extensions are sorted by activation time
- Disable extensions with >1s activation time if not critical
-
Use Extension Bisect for Troubleshooting
Command Palette (⌘⇧P) → Help: Start Extension Bisect- Binary search to identify problematic extensions
- Automatically disables half of extensions at a time
-
Monitor Extension Host CPU Usage
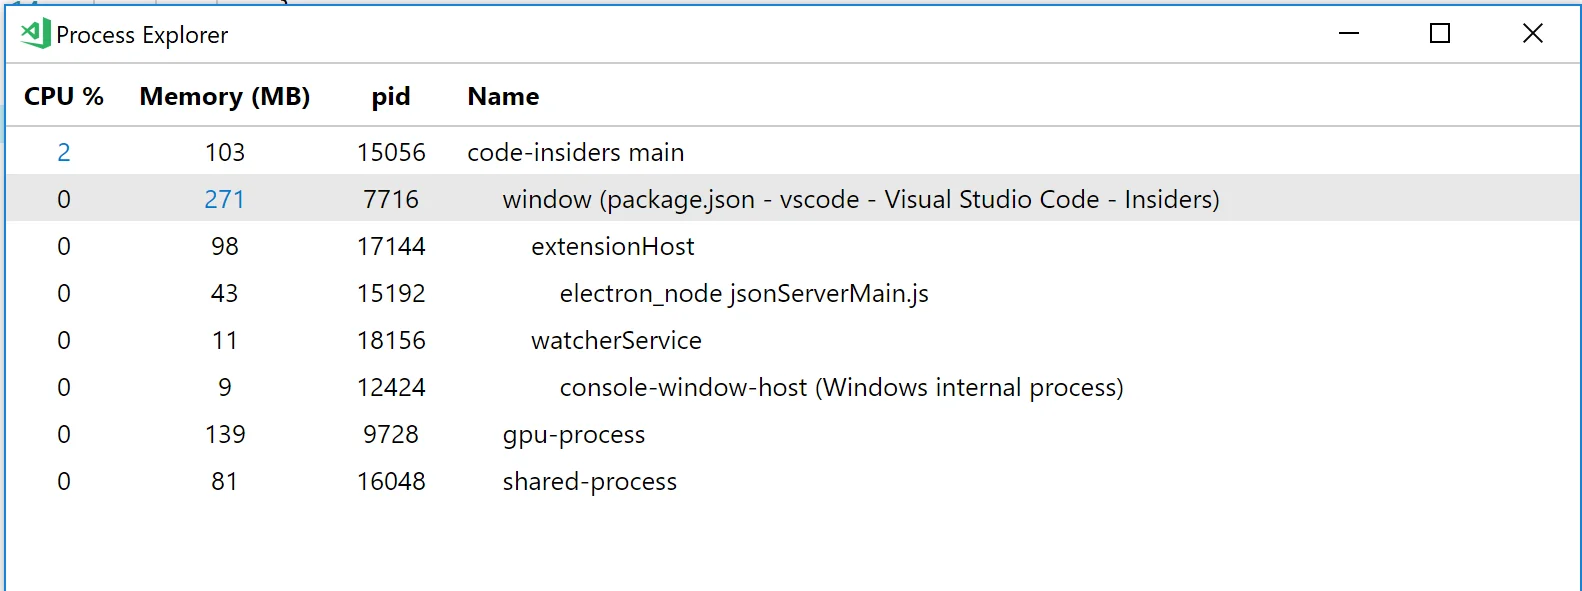
Command Palette (⌘⇧P) → Help: Open Process Explorer- Real-time CPU and memory usage per process
- Identify extensions causing performance issues
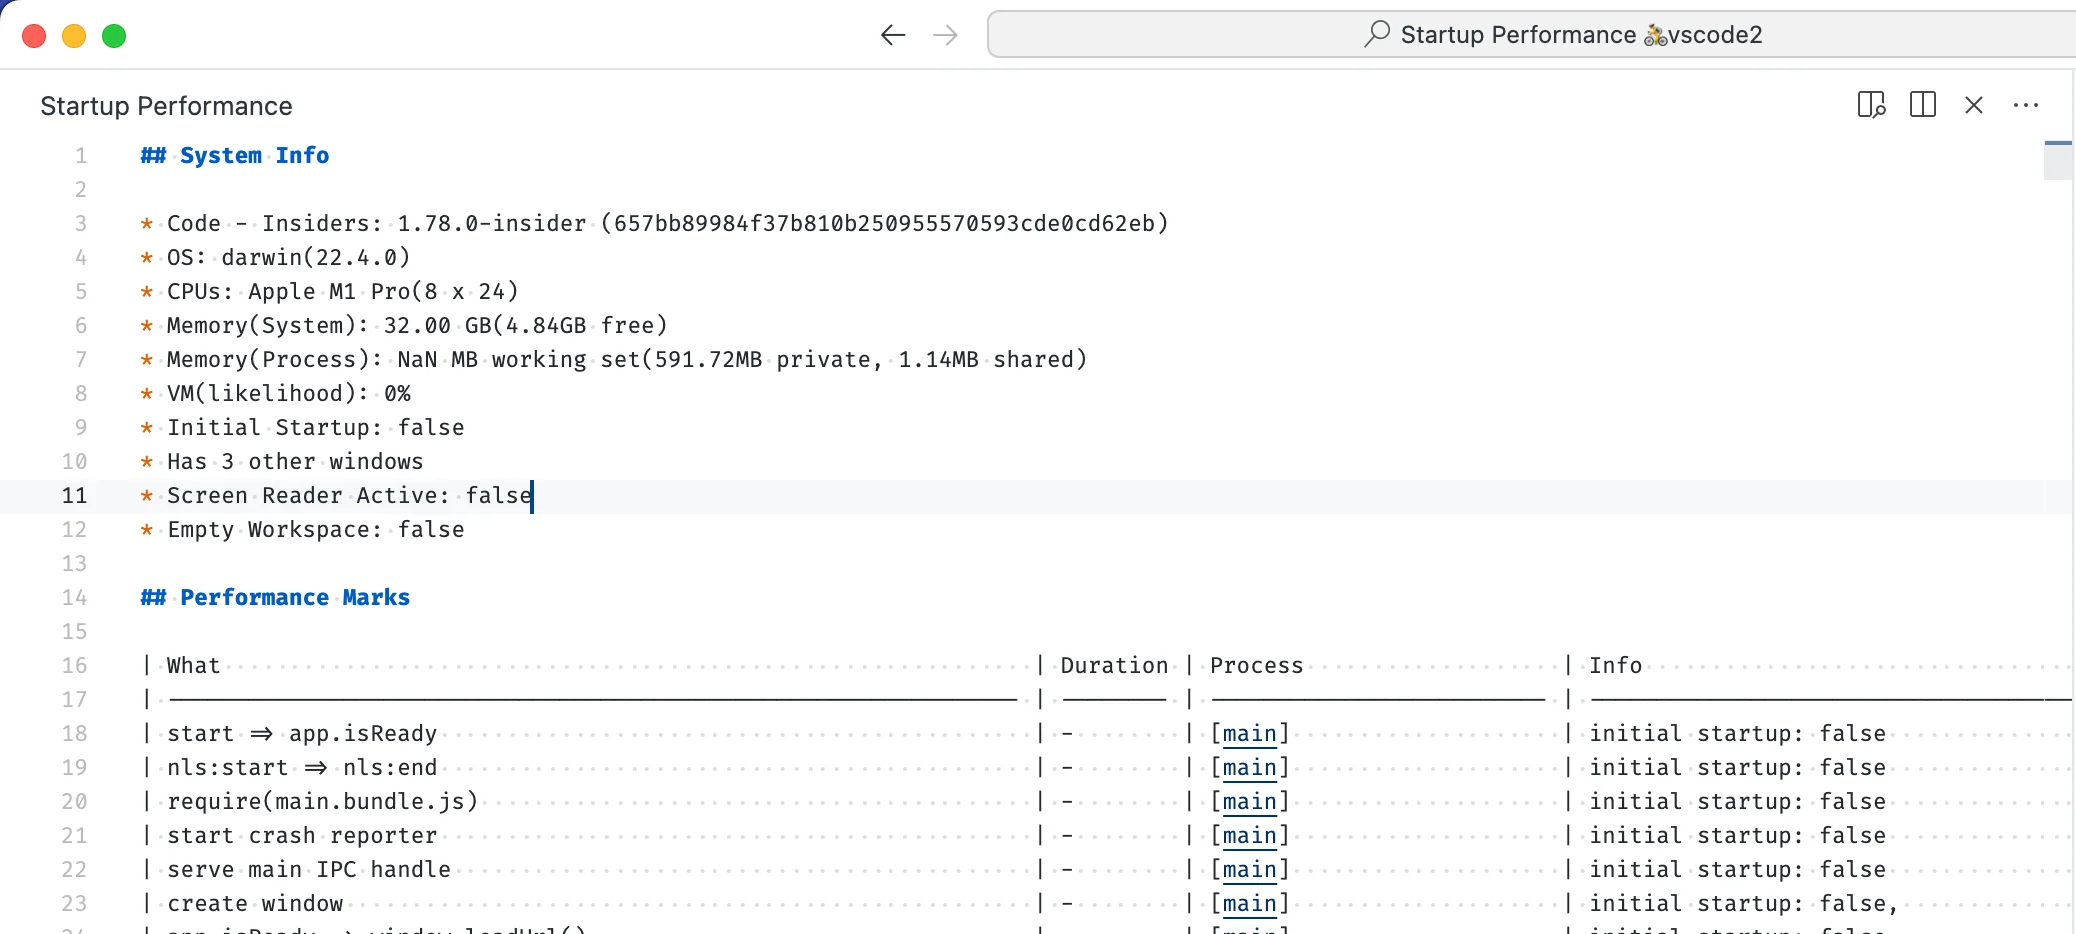
Performance Profiling:
# Startup performance analysis
Developer: Startup Performance

# Extension host profiling
Developer: Show Running Extensions

# Renderer process profiling
Developer: Toggle Developer Tools (⌘⌥I)
# Navigate to Performance tab → Record → Stop
Docker Desktop Optimization for macOS Tahoe
Recommended Resource Allocation:
- Docker Desktop → Settings → Resources
CPU: 4-8 cores (default: all available)
Memory: 4-8 GB (default: 2GB is too low!)
Swap: 2 GB (default: 1GB)
Disk Image Size: 64+ GB
VirtioFS Performance Improvements:
Docker Desktop 4.33+ includes significant VirtioFS optimizations:
- 3x faster than previous versions (was 5-6x slower than native)
- Increased directory cache timeout
- Optimized host change notifications
- Removed extra FUSE operations
Enable Synchronized File Shares:
Docker Desktop 4.27+ offers 59% speed improvement for builds:
- Settings → Features → Enable "Synchronized file shares"
- Requires Docker Desktop paid subscription ($7-9/month)
Alternative: Docker VMM (Apple Silicon Only)
Performance Gains:
- 2x faster with cold cache
- Up to 25x faster with warm cache
- Can exceed native Mac filesystem operations!
Limitation: Does not support Rosetta 2 for x86_64 binaries
Package Manager Performance: npm vs Yarn vs pnpm
2025 Performance Benchmarks:
| Package Manager | Install Time (1000 deps) | Disk Space | Market Share |
|---|---|---|---|
| pnpm | 767ms | 70-80% less | 19.9% |
| Yarn PnP | 707ms | Standard | 21.5% |
| Yarn Classic | ~2.5s | Standard | (included above) |
| npm | ~5s+ | Baseline | 56.6% |
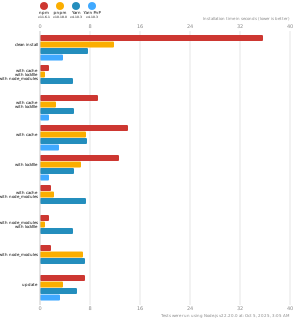
Recommendation: Switch to pnpm
Why pnpm:
- Fastest Installs: 767ms vs npm's 5+ seconds
- Disk Space Savings: 70-80% less storage used
- Strictest Dependency Management: No phantom dependencies
- Perfect for Monorepos: Built-in workspace support
Installation:
# Install pnpm via Homebrew
brew install pnpm

# Or via official installer
curl -fsSL https://get.pnpm.io/install.sh | sh -

# Migrate existing project
pnpm import  # Converts package-lock.json to pnpm-lock.yaml
pnpm install
Homebrew Optimization on macOS Tahoe
Ensure Latest Homebrew Version:
macOS Tahoe 26 requires Homebrew 4.6.0+ for full compatibility.
# Update Homebrew
brew update

# Check version (should be 4.6.0+)
brew --version

# Health check
brew doctor
⚠️ Critical Notice for Intel Mac Users:
macOS Tahoe 26 is the last version supporting Intel x86_64 architecture. Homebrew will drop Intel support in a future release.
Performance Optimizations:
# Regular cleanup (run monthly)
brew cleanup -s              # Remove old versions
brew autoremove             # Remove unused dependencies

# Parallel downloads (add to ~/.zshrc)
export HOMEBREW_PARALLEL=4

# Disable analytics
brew analytics off
Alternative Solutions and Native App Frameworks
Why Consider Native Alternatives?
Performance Benefits:
- 50-70% Less Memory Usage: Native apps use 200-500MB vs Electron's 500MB-1GB
- Faster Startup: 2-3x faster cold starts
- Better Battery Life: 20-30% improvement
- Thermal Efficiency: Significantly reduced heat generation
- Smaller App Size: 3-10MB vs 100-200MB for Electron apps
Top Native App Frameworks for Mac Development
1. Tauri (Rust + Web) - Best Balance
Pros:
- 50% less memory than Electron
- 3-10MB bundle size (vs 100-200MB Electron)
- Native performance with web UI flexibility
- Growing ecosystem and community
Cons:
- Smaller ecosystem than Electron
- Requires Rust knowledge for advanced features
Best For: New projects prioritizing performance
2. Swift/SwiftUI - Maximum Performance
Pros:
- Maximum macOS integration
- Apple's first-party framework
- Excellent performance and battery life
- Native UI components
Cons:
- macOS-only (not cross-platform)
- Steeper learning curve
- Requires Xcode and Swift knowledge
Best For: Mac-exclusive applications
3. Flutter - Google's Cross-Platform Solution
Pros:
- Single codebase for Mac, Windows, Linux, iOS, Android
- Beautiful, consistent UI
- Hot reload for fast development
- Good performance (compiled to native)
Cons:
- Larger app size than native Swift
- Less macOS-native feel
- Learning curve for Dart language
Best For: Cross-platform apps with modern UI
Rosetta 2 vs Native Performance (Apple Silicon)
Performance Comparison:
| Metric | Native Apple Silicon | Rosetta 2 (Intel Apps) |
|---|---|---|
| Single-Core Performance | 100% | 78-79% |
| Multi-Core Performance | 100% | 75-80% |
| Memory Efficiency | Excellent | Good (90%+) |
| Battery Life | Excellent | 20-30% worse |
| Thermal Performance | Cool | Warmer |
Real-World Examples:
Cubase 12 (Audio Production):
- Native: Full performance, excellent efficiency
- Rosetta 2: 30% slower rendering, higher CPU usage
Adobe Lightroom:
- Native: Minimal difference in typical workflows
- Rosetta 2: Slight lag during heavy batch processing
Recommendation: Always use native Apple Silicon apps when available for best performance on M-series Macs.
Performance Monitoring Tools: Track and Optimize
Free Monitoring Solutions
1. Activity Monitor (Built-in)
How to Use:
- Applications → Utilities → Activity Monitor
- CPU Tab: Identify CPU-intensive processes
- Memory Tab: Check memory pressure
- Energy Tab: See battery impact per app
- Disk Tab: Monitor disk activity
- Network Tab: Track network usage
Keyboard Shortcuts:
- Force Quit: ⌘ + Option + Escape
- Quit Process: Select process → ⌘ + Q
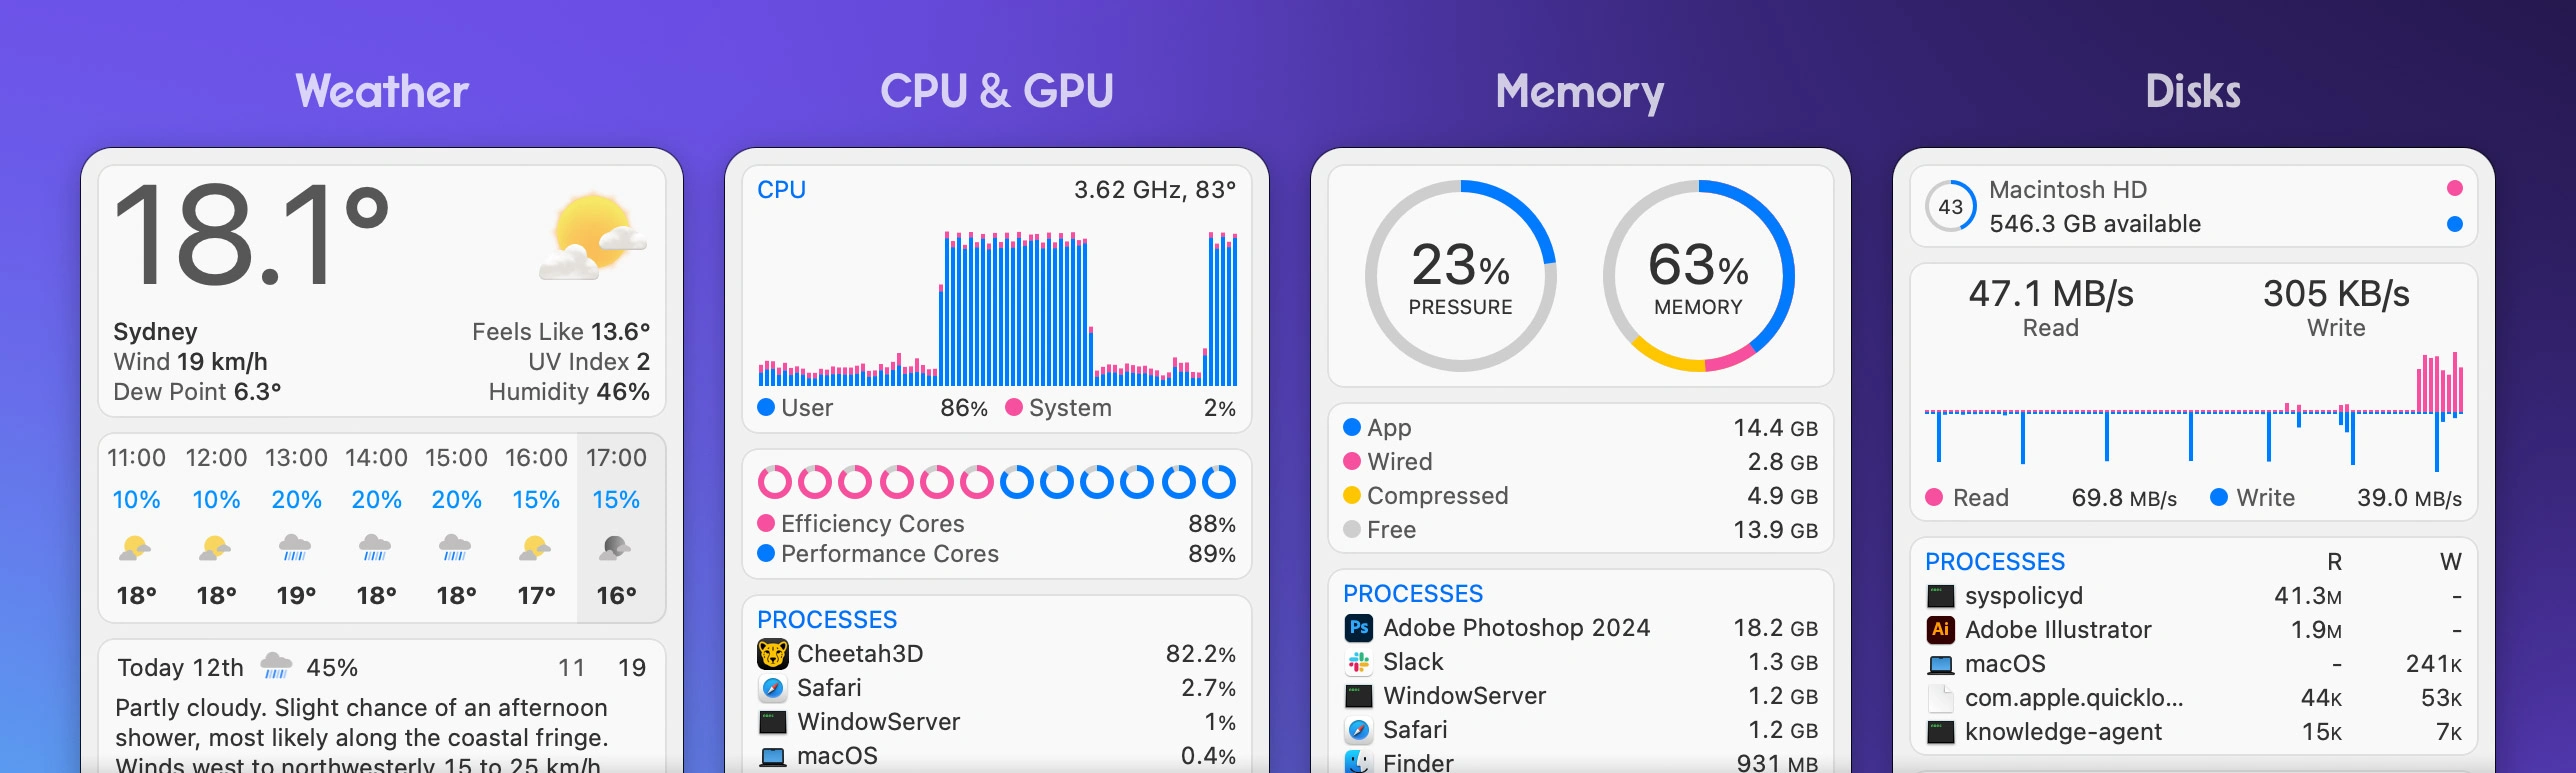
2. Stats (Free, Open Source)
Features:
- Menu bar system monitoring
- CPU, GPU, memory, network, battery stats
- Highly customizable
- Zero performance overhead
Installation:
brew install stats

# Or download from: https://github.com/exelban/stats
Premium Monitoring Tools
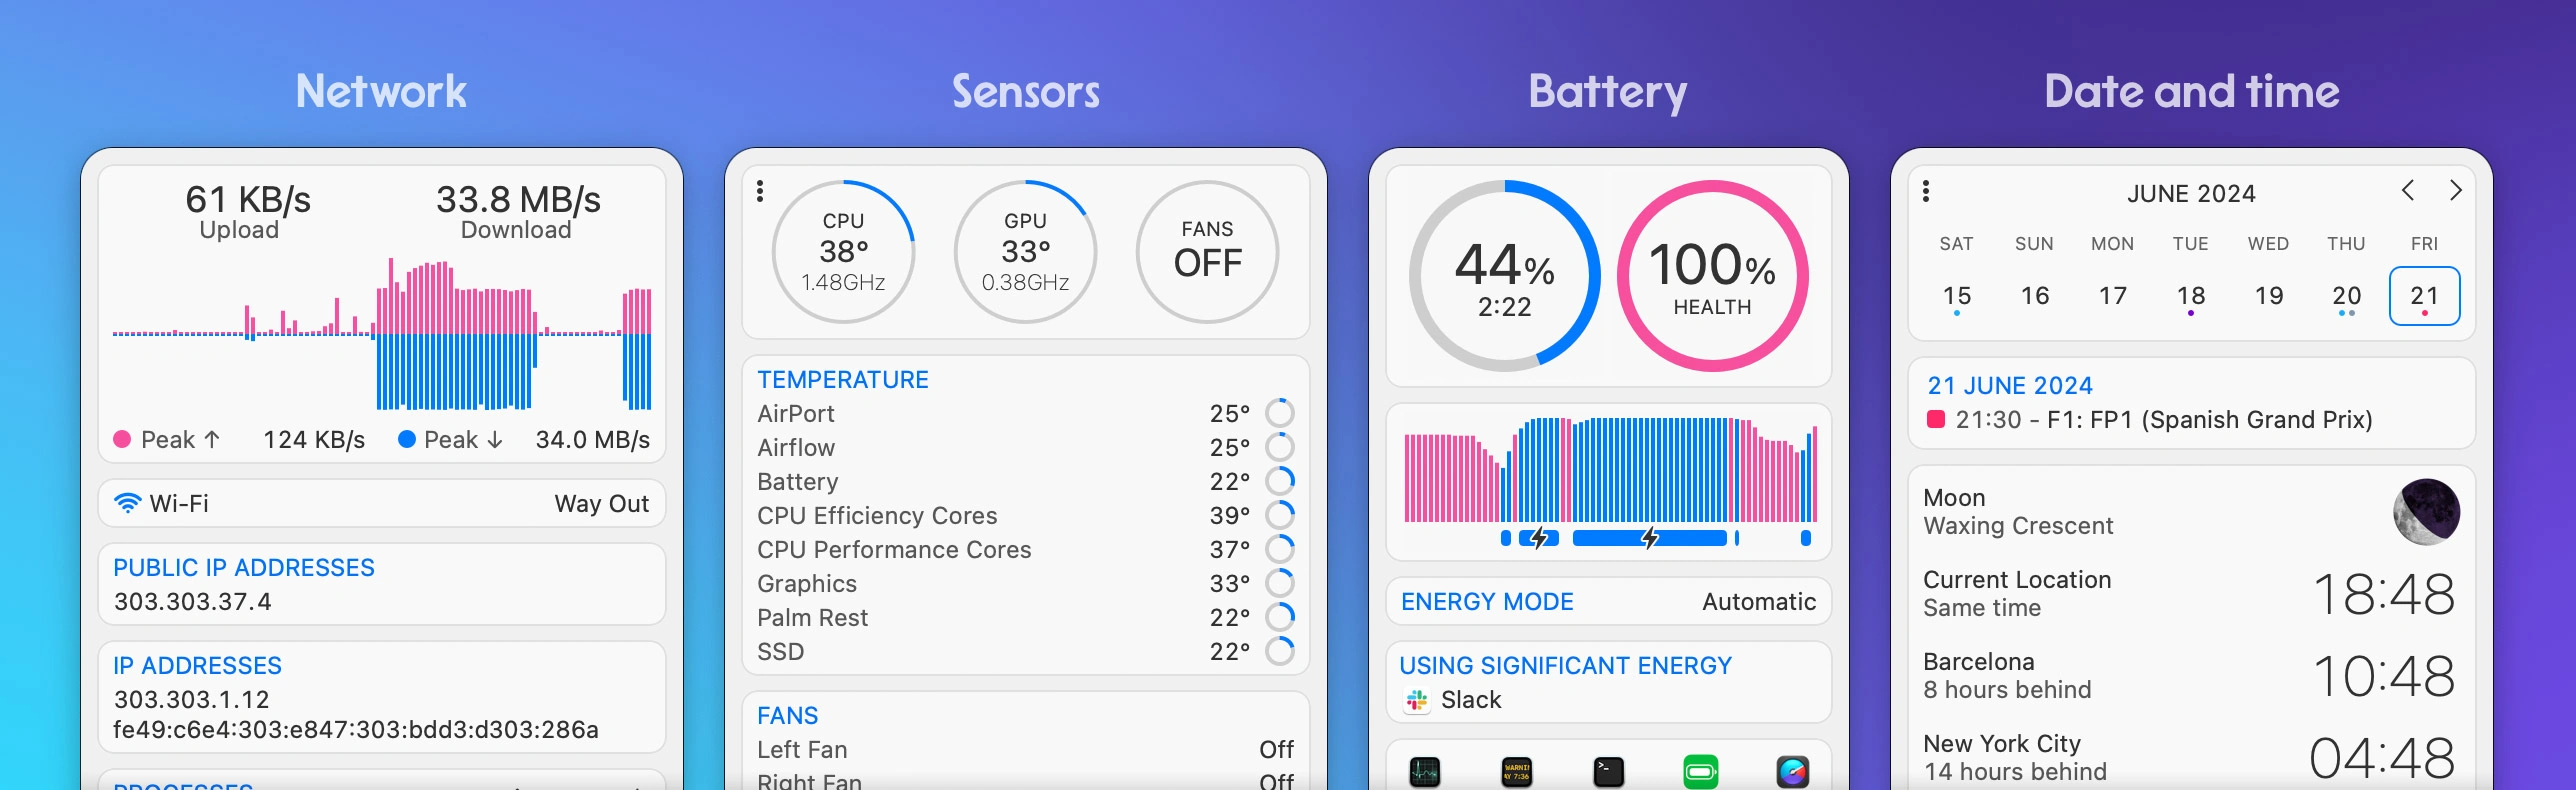
1. iStat Menus ($18 one-time)
Features:
- Comprehensive menu bar monitoring
- CPU, GPU, memory, disks, network, sensors
- Historical graphs and notifications
- Weather integration
- Fully native Apple Silicon app
Why iStat Menus:
- Gold standard for Mac monitoring
- Highly detailed sensor data
- Excellent customization options
- Worth the investment for professionals
Installation:
- Purchase from: https://bjango.com/mac/istatmenus/
- 14-day free trial available
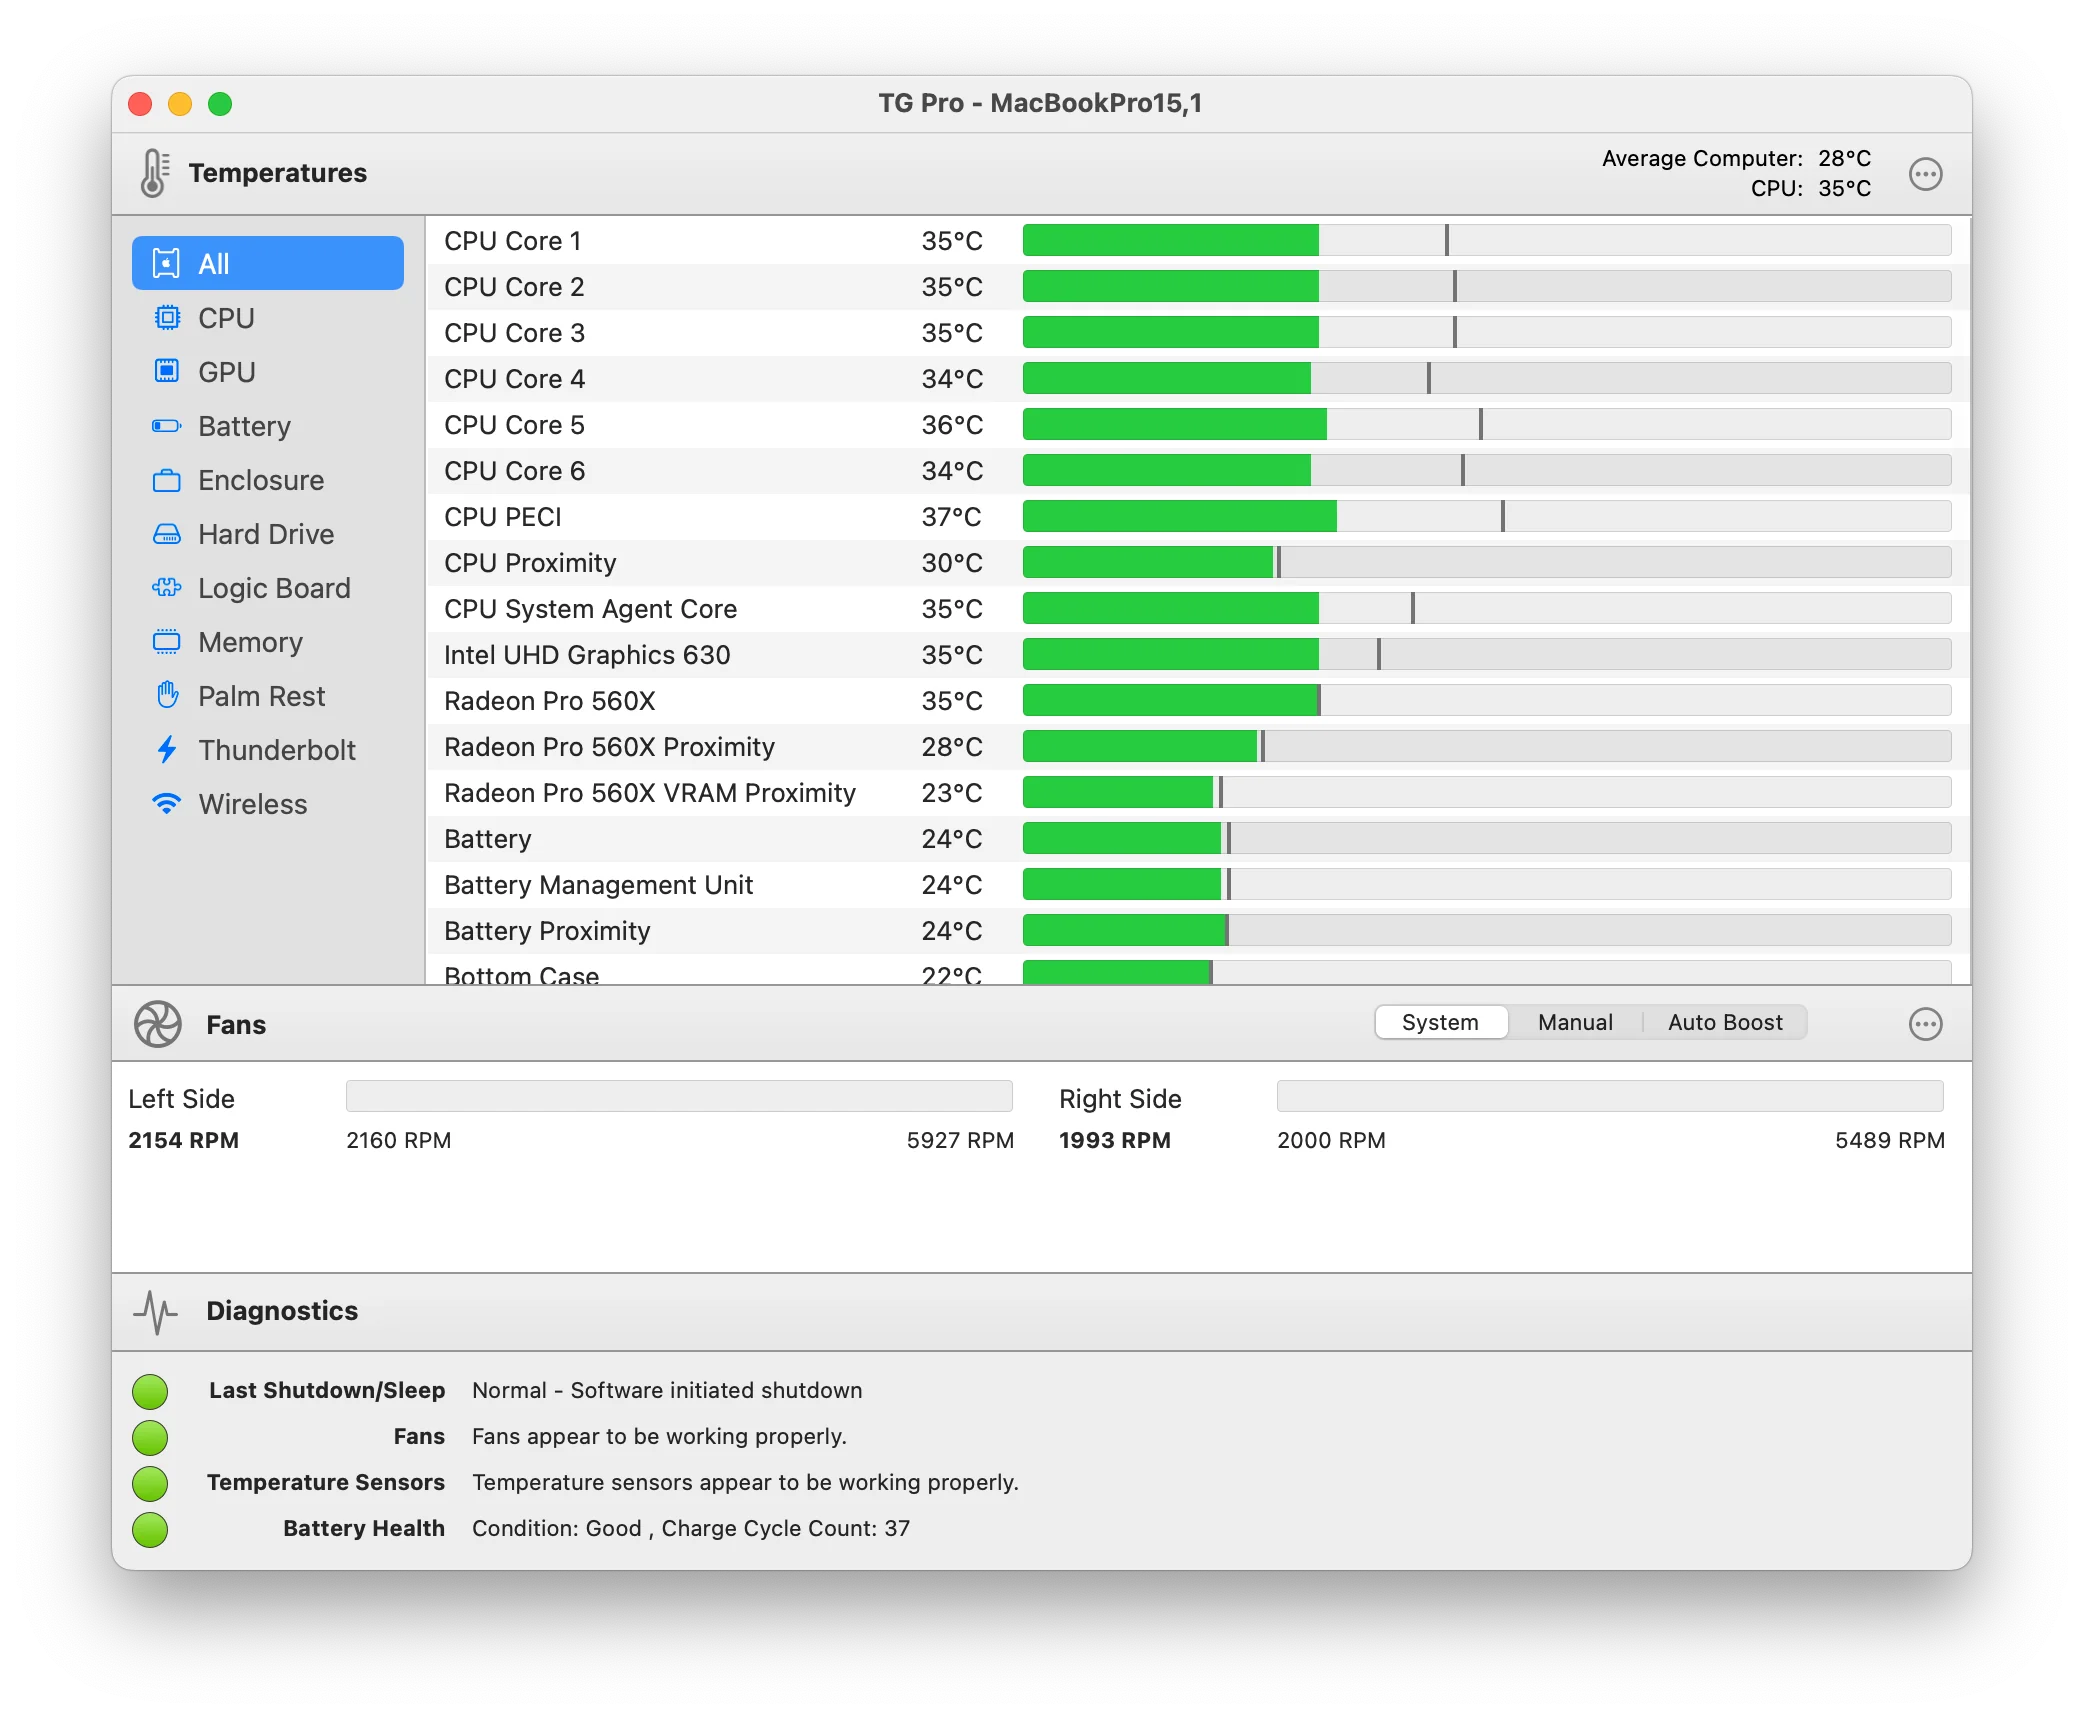
2. TG Pro ($20 one-time)
Features:
- Advanced temperature monitoring
- Custom fan control
- Comprehensive diagnostics
- Hardware health monitoring
- Alerts for abnormal temperatures
Why TG Pro:
- Best thermal management solution
- Prevents overheating damage
- Essential for heavy workloads
- Particularly useful for Intel Macs
Installation:
- Purchase from: https://www.tunabellysoftware.com/tgpro/
- Free trial available
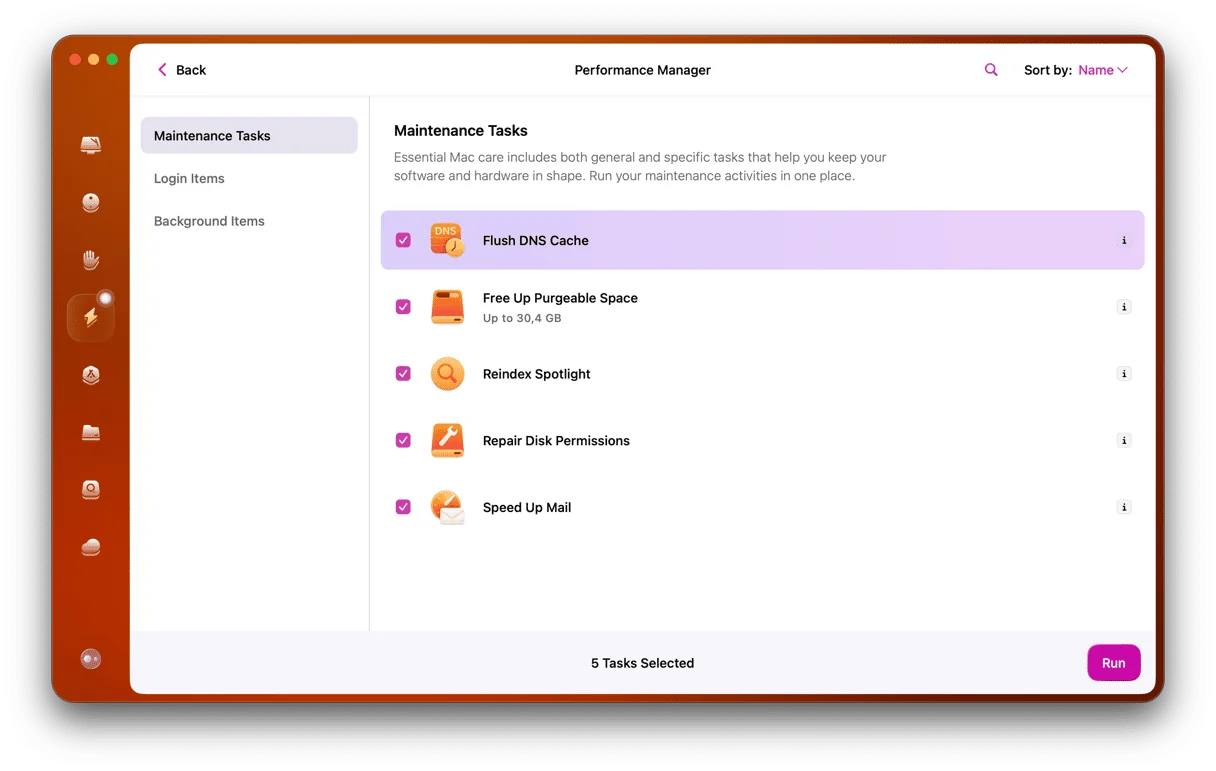
3. CleanMyMac X ($39.95/year or $89.95 lifetime)
Features:
- System optimization and cleanup
- Performance monitoring
- Malware removal
- Uninstaller for complete app removal
- Maintenance scripts
Why CleanMyMac X:
- All-in-one solution
- Automated maintenance
- User-friendly interface
- Significant time savings
Installation:
- Purchase from: https://macpaw.com/cleanmymac
- 7-day free trial
Recommended Monitoring Setup by User Type
Budget User ($0):
- Stats (free monitoring)
- Activity Monitor (built-in)
- Manual maintenance
Casual User ($40/year):
- CleanMyMac X (automated)
- Stats (quick monitoring)
Power User ($38-58 one-time):
- iStat Menus ($18)
- TG Pro ($20) - if thermal concerns
- Stats (backup monitoring)
Professional ($38 + tools):
- iStat Menus + TG Pro
- CleanMyMac X for automation
- Custom monitoring scripts
Preventive Maintenance Strategies: Long-Term Performance
Daily Practices (2-5 minutes)
1. Close Unused Applications
# Quick app check
⌘ + Tab  # View all running apps
⌘ + Q    # Quit selected app
2. Manage Browser Tabs
- Close tabs you're not actively using
- Use tab grouping or bookmarks for "read later" content
- Each tab = 50-200MB of RAM
3. Restart Electron Apps
- Quit and relaunch long-running Electron apps daily
- Clears memory leaks and accumulated resources
- Takes 5 seconds, saves hours of slowdown
Weekly Practices (15-30 minutes)
1. System Restart
# Recommended: Once per week
→ Restart...- Clears system-level memory leaks
- Resets WindowServer and other core processes
- Applies pending system updates
2. Update Applications
- Check App Store updates
- Update Homebrew packages:
brew upgrade - Update npm global packages:
npm update -g
3. Quick System Cleanup
# Clear system caches
rm -rf ~/Library/Caches/*

# Empty trash
 → Empty Trash

# Clear Downloads folder
# Review and delete unnecessary files
Monthly Practices (30-60 minutes)
1. Deep Cleanup with CleanMyMac X
- Run System Junk cleanup
- Clear large and old files
- Optimize storage with file compression
2. Storage Optimization
# Check disk usage
df -h

# Find large files
du -sh ~/Documents/* | sort -h

# Optimize Photos library
Photos → File → Optimize Mac Storage
3. Extension and Plugin Audit
- VSCode: Review and disable unused extensions
- Safari: Check and remove unnecessary extensions
- System Preferences: Review Login Items
Quarterly Practices (1-2 hours)
1. Complete System Cleanup
- Run all CleanMyMac X modules
- Clear all browser caches and history
- Remove unused applications completely
2. SMC and NVRAM Reset (If Issues Persist)
Reset SMC (Apple Silicon):
- Shut down Mac
- Wait 30 seconds
- Turn on Mac (No button combination needed on Apple Silicon)
Reset SMC (Intel Mac):
- Shut down Mac
- Press Shift + Control + Option + Power for 10 seconds
- Release, then turn on Mac
Reset NVRAM:
- Shut down Mac
- Turn on and immediately press Option + Command + P + R
- Hold for 20 seconds
- Release when you hear second startup sound
3. Time Machine Backup Verification
- Ensure backups are running successfully
- Test restore from backup
- Verify backup disk health
Electron App-Specific Maintenance
Daily:
- Restart apps after 4-6 hours of continuous use
- Monitor memory usage in Activity Monitor
Weekly:
- Update to latest app versions
- Clear app caches when available
Monthly:
- Review alternatives to problematic apps
- Consider switching to native apps for critical workflows
Automation Options
CleanMyMac X Scheduling:
- CleanMyMac X → Preferences → Scheduler
- Set automatic cleanup scripts
- Weekly system maintenance recommended
Homebrew Auto-Update:
# Add to ~/.zshrc
export HOMEBREW_AUTO_UPDATE_SECS=86400  # Daily updates
Custom Maintenance Script:
#!/bin/bash
# Save as ~/maintenance.sh

# Update Homebrew
brew update && brew upgrade

# Clean Homebrew
brew cleanup -s && brew autoremove

# Update npm
npm update -g

# Clear system caches
rm -rf ~/Library/Caches/com.apple.Safari
rm -rf ~/Library/Caches/com.google.Chrome

# Empty trash
rm -rf ~/.Trash/*

echo "Maintenance complete!"
Make executable and run monthly:
chmod +x ~/maintenance.sh
~/maintenance.sh
Conclusion: Restoring Your Mac's Performance
The macOS Tahoe 26 Electron performance bug has been a significant challenge for developers and professionals worldwide, but with the right knowledge and tools, you can fully restore your Mac's performance and even optimize it beyond pre-Tahoe levels.
Key Takeaways
Immediate Actions:
- ✅ Check app update status at shamelectron.com
- ✅ Update fixed apps to versions with Electron 36.9.2, 37.6.0, or 38.2.0+
- ✅ Implement workarounds for apps still awaiting updates (minimize, full-screen, reduce transparency)
- ✅ Monitor performance with Activity Monitor or iStat Menus
- ✅ Consider native alternatives for critical workflows
Long-Term Optimizations:
- VSCode: Disable unnecessary extensions, optimize settings
- Docker: Increase memory allocation to 4-8GB
- Package Managers: Switch to pnpm for 70% disk savings and fastest installs
- Homebrew: Update to 4.6.0+, run regular cleanups
- System Maintenance: Implement daily, weekly, monthly maintenance routines
Performance Improvements You Can Expect:
- GPU Usage: 80-90% → 5-15% (after fixes)
- Battery Life: 30-50% improvement with native apps
- Memory Usage: 40-60% reduction with optimizations
- Startup Time: 2-3x faster with native alternatives
- Overall Responsiveness: Significant improvement (subjective but consistent)
Future Outlook
Short-Term (macOS Tahoe 26.1-26.3):
- More apps will implement Electron fixes in coming weeks
- Apple may optimize WindowServer further in point releases
- Community tracking at shamelectron.com will continue
Long-Term (2026+):
- Industry shift toward native frameworks (Tauri, Swift, Flutter)
- Electron maintainers learning from private API pitfalls
- macOS 27 will likely drop Intel support entirely, optimizing further for Apple Silicon
Recommended Monitoring Setup
For All Users:
- Activity Monitor: Built-in, essential for troubleshooting
- Stats: Free menu bar monitoring (highly recommended)
For Professionals:
- iStat Menus ($18): Comprehensive monitoring, worth every penny
- TG Pro ($20): Thermal management, especially for Intel Macs
- CleanMyMac X ($40/year): Automated maintenance, huge time saver
Getting Help
If you continue experiencing performance issues after implementing these fixes:
- Check macOS Updates: Ensure you're on macOS 26.0.1 or later
- Verify App Versions: Confirm apps are using fixed Electron versions
- Reset SMC/NVRAM: Try system controller resets
- Apple Support: Contact Apple if hardware-related
- Community Forums: Reddit r/MacOS, Apple Support Communities
Final Thoughts
While the Electron performance bug has been frustrating, it highlights the importance of maintaining your Mac proactively and staying informed about system-level changes. macOS Tahoe 26 brings significant improvements in other areas—revolutionary Liquid Glass UI, enhanced Apple Intelligence, and major security upgrades—that make it worth using once the Electron issues are resolved.
By following this guide, you'll not only fix the current Electron performance issues but also optimize your Mac for long-term peak performance in the Tahoe era and beyond.
Ready to optimize your entire macOS Tahoe system? Explore our complete performance analysis for detailed benchmarks across all Mac hardware configurations.
Having other macOS Tahoe issues? Check our complete troubleshooting guide for solutions to common problems including WiFi drops, battery drain, and external display issues.