macOS Tahoe Memory Leak Fix 2026: Complete Guide for Calculator, Pages, Safari & System Apps Using Excessive RAM
Fix macOS Tahoe memory leak issues affecting Calculator, Pages, Safari, Finder, and other system apps. Complete troubleshooting guide with proven solutions for excessive RAM usage, memory pressure problems, and app crashes.
If you've upgraded to macOS Tahoe 26 and noticed your Mac's memory usage spiraling out of control, you're experiencing one of the most frustrating bugs in recent macOS history. Users worldwide are reporting that simple apps like Calculator are consuming 42GB or more of RAM, Pages is using an astronomical 175GB+ of memory, and Safari tabs are eating through available resources at an unprecedented rate.
This comprehensive guide will help you understand why these memory leaks are occurring, how to diagnose them effectively, and most importantly, how to fix them so your Mac returns to its normal, efficient operation.
Executive Summary: The macOS Tahoe Memory Crisis
The Scope of the Problem
Since the release of macOS Tahoe 26.0 in September 2025, and continuing through the 26.0.1 and 26.1 updates, users have reported severe memory management issues affecting both Apple's built-in applications and third-party software. What makes this situation particularly frustrating is that these memory leaks affect apps that should use minimal resources.
Reported Memory Usage Anomalies:
- Calculator: Up to 42GB+ RAM (normal: under 50MB)
- Pages: Up to 175GB+ RAM (normal: 200MB-1GB depending on document)
- Safari: Individual tabs consuming 8-15GB each
- Finder: Growing to 10GB+ over time
- Messages: Accumulating 5-8GB without clearing
- Photos: Using 20GB+ even when idle
- Mail: Consuming 6-12GB with moderate mailboxes
Impact on Users
Typical Symptoms:
- System becomes increasingly sluggish over hours of use
- Rainbow spinning beach ball appears frequently
- Apps take longer to launch and respond
- Fan noise increases dramatically
- Mac becomes hot to the touch
- Swap file usage spikes to 20GB+ on disk
- Kernel task CPU usage increases
- Force restarts become necessary
- Work productivity severely impacted
Affected Systems:
- MacBook Air M1/M2/M3/M4
- MacBook Pro 14" and 16" (all Apple Silicon generations)
- Mac mini M1/M2/M4
- Mac Studio M1/M2 Max/Ultra
- Mac Pro M2 Ultra
- iMac M1/M3/M4
- Intel Macs (limited reports, but still affected)
For users dealing with general performance issues beyond memory, our guide on fixing Mac running slow provides additional optimization strategies.
Understanding the Memory Leak Crisis: What Went Wrong
The Technical Background
Memory leaks occur when an application allocates memory but fails to release it when it's no longer needed. Over time, these unreleased memory blocks accumulate, consuming more and more RAM until the system becomes unstable or the application crashes.
In macOS Tahoe 26, several factors have contributed to widespread memory leaks:
1. Liquid Glass UI Framework Changes
The new Liquid Glass design language in macOS Tahoe required significant changes to how windows, transparency effects, and animations are rendered. These changes appear to have introduced memory management bugs in the rendering pipeline.
2. WindowServer Memory Retention
The WindowServer process, responsible for drawing all on-screen elements, has been observed retaining texture data and window snapshots that should be purged. This affects every application that displays content on screen.
3. App-Specific Memory Management Bugs
Apple's built-in applications were updated to support new Tahoe features, but several of these updates introduced memory allocation bugs. Calculator, Pages, and Safari have been particularly affected.
4. iCloud Sync Memory Accumulation
Applications that sync with iCloud (Messages, Photos, Notes, Reminders) are experiencing memory accumulation during synchronization processes that doesn't get released properly.
Why Simple Apps Are Most Affected
It may seem counterintuitive that Calculator could use 42GB of RAM, but the explanation lies in how macOS Tahoe handles memory for even simple operations:
The Calculator Bug Specifically:
- Each calculation triggers memory allocation for UI updates
- The new Liquid Glass transparency effects allocate texture memory
- Memory used for rendering is not being properly released
- Over time, repeated calculations cause exponential memory growth
- The app doesn't crash because macOS uses swap space to compensate
The Pages Bug Mechanism:
- Document rendering allocates memory for each page element
- Auto-save creates memory snapshots that aren't fully released
- Version history tracking holds onto memory buffers
- iCloud sync operations add additional memory overhead
- Complex documents with images accelerate the leak
Identifying Memory Leaks: Diagnostic Process
Step 1: Access Activity Monitor
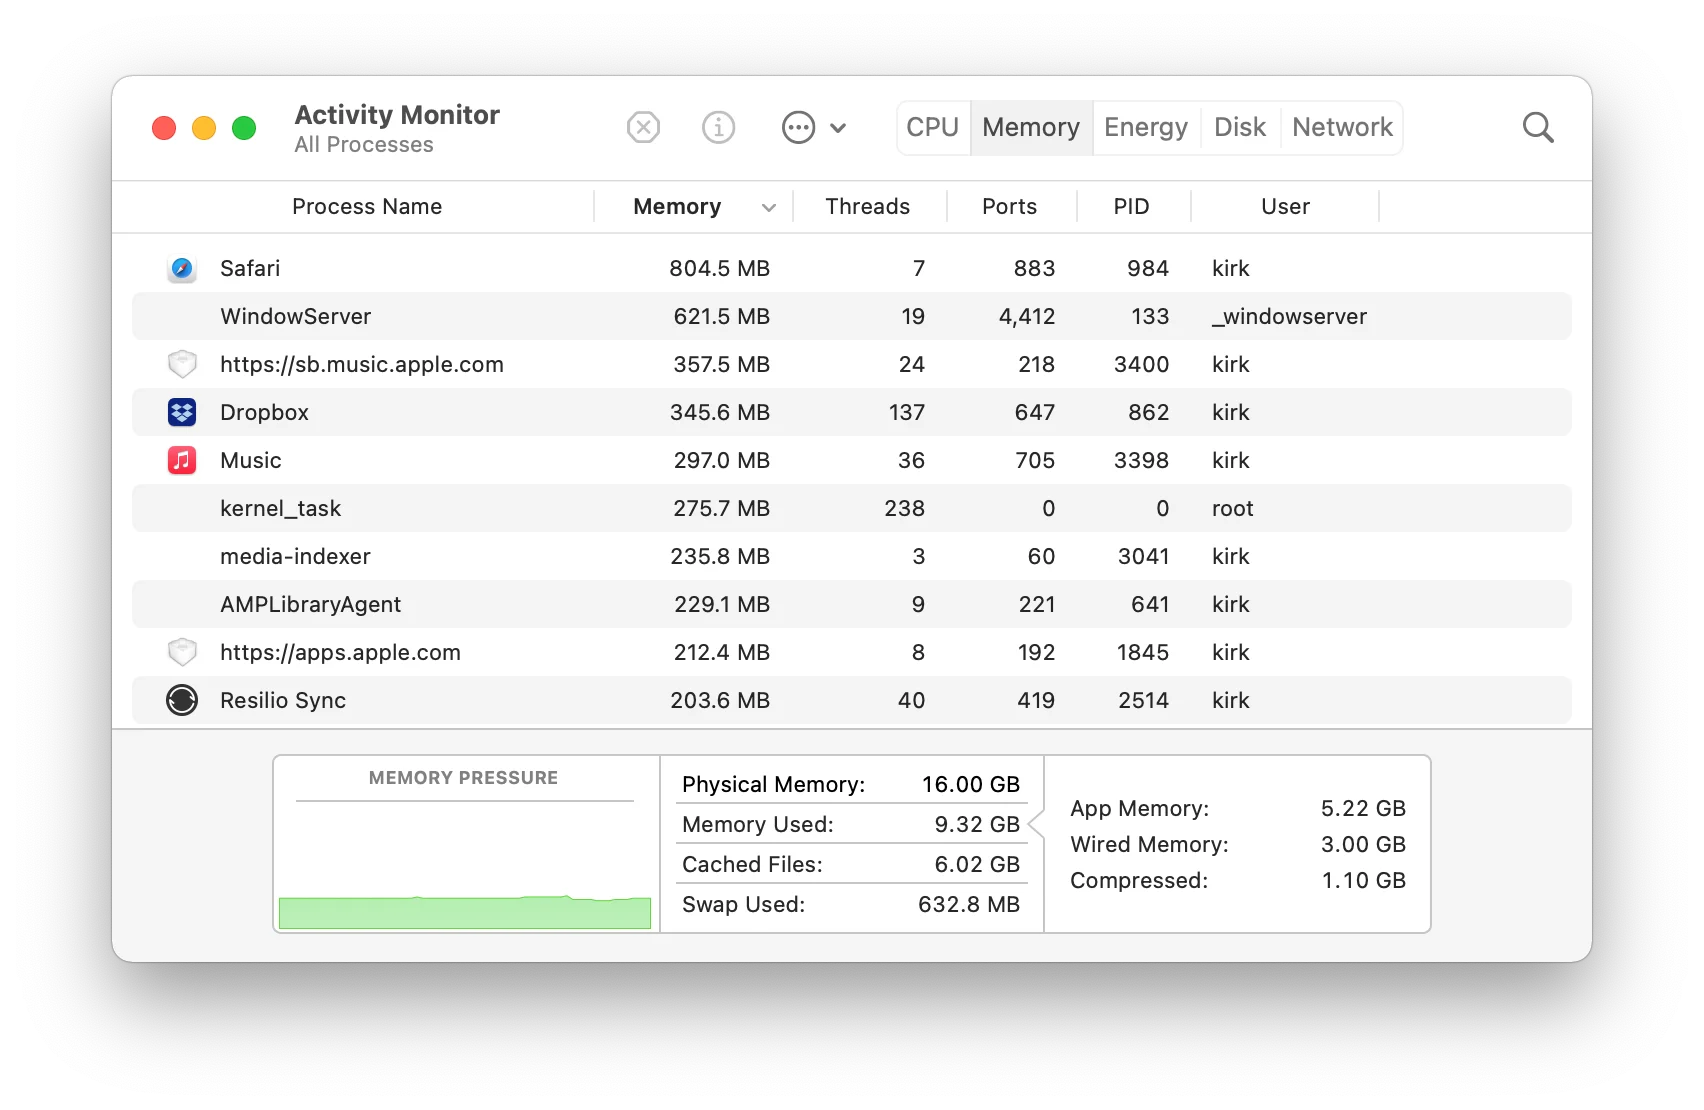
Activity Monitor is your primary tool for diagnosing memory issues. Here's how to use it effectively:
Opening Activity Monitor:
- Press
Command + Spaceto open Spotlight - Type "Activity Monitor" and press Enter
- Click the "Memory" tab at the top of the window
Understanding the Memory Tab:
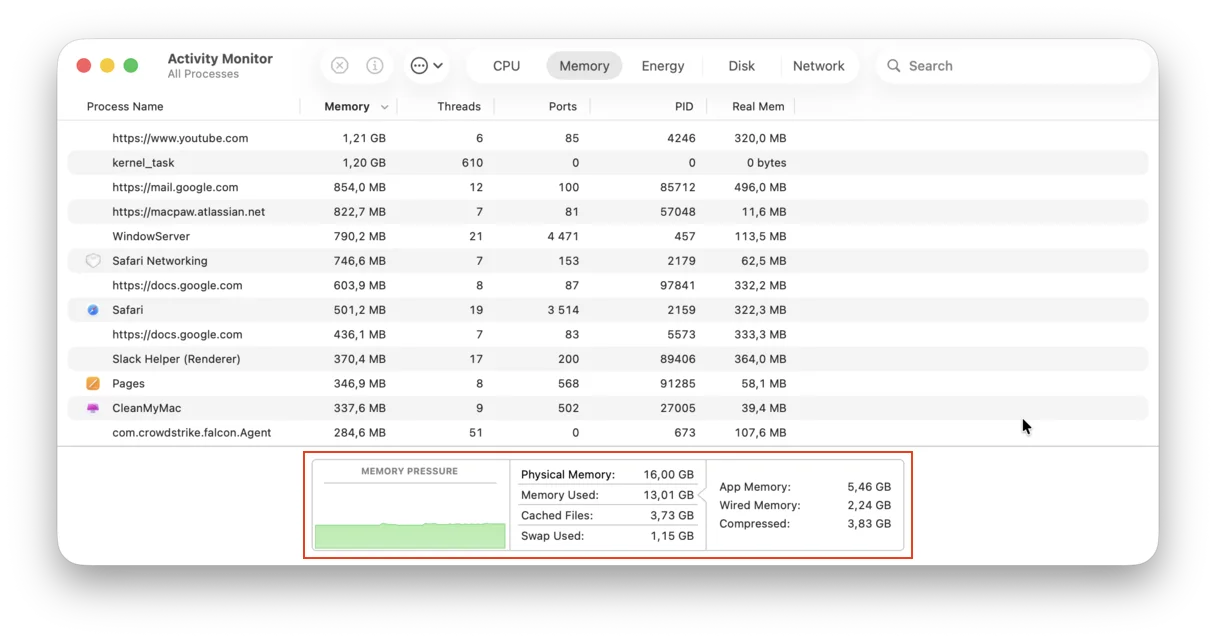
Key Metrics to Monitor:
- Memory Pressure Graph: Shows real-time system memory status
- Physical Memory: Total RAM installed in your Mac
- Memory Used: Total RAM currently in use
- Cached Files: RAM used for file caching (can be freed if needed)
- Swap Used: Disk space used as virtual memory (critical indicator)
For a deeper understanding of Activity Monitor, check our complete Activity Monitor guide.
Step 2: Identify Culprit Processes
Sort processes by memory usage to find the culprits:
- Click the "Memory" column header to sort by RAM usage
- Look for processes using disproportionate amounts of memory
- Note which processes are growing over time
Common Memory Leak Culprits in macOS Tahoe:
| Process Name | Normal Usage | Leak Indicator |
|---|---|---|
| Calculator | 20-50 MB | 1GB+ |
| Pages | 200MB-1GB | 5GB+ |
| Safari | 500MB-2GB total | 10GB+ |
| Finder | 200-500MB | 3GB+ |
| Messages | 100-300MB | 2GB+ |
| Photos | 500MB-2GB | 8GB+ |
| 200-500MB | 3GB+ | |
| WindowServer | 200-500MB | 2GB+ |
Step 3: Monitor Memory Pressure
The memory pressure indicator is the most important diagnostic tool:

Memory Pressure Colors:
- Green: Healthy memory usage, plenty of RAM available
- Yellow: Memory resources are being taxed, performance may degrade
- Red: Critical memory shortage, system is using heavy swap
What Sustained Yellow or Red Means:
If your memory pressure stays yellow or red for extended periods, especially when you're not running demanding applications, you're experiencing memory leaks.
Step 4: Terminal Diagnostic Commands
For more detailed analysis, use these Terminal commands:
Check Overall Memory Status:
# Display memory statistics
vm_stat

# More readable memory info
top -l 1 | head -n 10

# Detailed memory breakdown
sudo memory_pressure
Monitor Memory in Real-Time:
# Watch memory every 2 seconds
while true; do vm_stat | head -5; sleep 2; echo "---"; done
Check Swap Usage:
# Show swap file usage
sysctl vm.swapusage

# Detailed swap statistics
ls -lh /private/var/vm/
Find Processes Using Most Memory:
# Top 20 memory-consuming processes
ps aux --sort=-%mem | head -20

# Specific process memory details
ps -o pid,rss,comm -p $(pgrep Calculator)
Check for Memory Pressure History:
# View memory pressure logs
log show --predicate 'subsystem == "com.apple.memorystatus"' --last 1h
Step 5: Advanced Diagnostics with Instruments
For developers or advanced users, Xcode's Instruments provides detailed memory analysis:
- Install Xcode from the App Store
- Open Instruments (Applications > Xcode > Open Developer Tool > Instruments)
- Select "Leaks" or "Allocations" template
- Attach to a running process or launch an app
- Monitor for memory growth patterns
Proven Fixes for macOS Tahoe Memory Leaks
Fix 1: Force Quit and Restart Affected Apps
The simplest immediate fix is to force quit apps that are consuming excessive memory:
Using Activity Monitor:
- Open Activity Monitor
- Select the problematic process
- Click the "X" button in the toolbar
- Choose "Force Quit"
- Reopen the application
Using Keyboard Shortcut:
- Press
Command + Option + Escape - Select the problematic app
- Click "Force Quit"
Using Terminal:
# Force quit Calculator
killall Calculator

# Force quit Pages
killall Pages

# Force quit Safari (will close all windows)
killall Safari

# Force quit Finder (it will restart automatically)
killall Finder
Important Note: While force quitting provides temporary relief, the memory leak will recur. This is a symptom management approach, not a permanent fix.
Fix 2: Clear Application Caches
Corrupted or oversized caches can contribute to memory issues:
Clear Safari Caches:
- Open Safari
- Go to Safari menu > Settings (or Preferences)
- Click "Privacy" tab
- Click "Manage Website Data"
- Click "Remove All"
- Confirm removal
Or use Terminal:
# Clear Safari cache
rm -rf ~/Library/Caches/com.apple.Safari/
rm -rf ~/Library/Safari/LocalStorage/

# Clear Safari web content
rm -rf ~/Library/Caches/com.apple.WebKit.WebContent/
Clear System Caches:
# Clear user cache folder (safe)
rm -rf ~/Library/Caches/*

# Clear derived data (for developers)
rm -rf ~/Library/Developer/Xcode/DerivedData/*

# Clear temporary files
rm -rf /private/var/folders/*/*/com.apple.*
Clear Specific App Caches:
# Clear Pages cache
rm -rf ~/Library/Caches/com.apple.iWork.Pages/

# Clear Calculator preferences (this resets Calculator)
rm ~/Library/Preferences/com.apple.calculator.plist

# Clear Finder preferences
rm ~/Library/Preferences/com.apple.finder.plist
killall Finder
Fix 3: Reset Application Preferences
Sometimes corrupted preferences cause memory leaks. Here's how to reset them:
Reset Calculator:
# Remove Calculator preferences
defaults delete com.apple.calculator

# Remove Calculator containers
rm -rf ~/Library/Containers/com.apple.calculator/
Reset Pages:
# Remove Pages preferences
defaults delete com.apple.iWork.Pages

# Remove Pages containers (Warning: backup documents first)
rm -rf ~/Library/Containers/com.apple.iWork.Pages/
Reset Safari (Comprehensive):
# Backup bookmarks first
cp ~/Library/Safari/Bookmarks.plist ~/Desktop/Safari_Bookmarks_Backup.plist

# Reset Safari preferences
defaults delete com.apple.Safari

# Clear Safari state
rm -rf ~/Library/Safari/
rm -rf ~/Library/Caches/com.apple.Safari/
rm -rf ~/Library/Saved\ Application\ State/com.apple.Safari.savedState/

# Clear WebKit data
rm -rf ~/Library/WebKit/
Reset Finder:
# Reset Finder preferences
defaults delete com.apple.finder

# Clear Finder saved state
rm -rf ~/Library/Saved\ Application\ State/com.apple.finder.savedState/

# Restart Finder
killall Finder
Fix 4: System Cache Cleanup
Perform a comprehensive system cache cleanup:
Safe Cache Cleanup Script:
#!/bin/bash
# macOS Tahoe Cache Cleanup Script

echo "Starting cache cleanup..."

# User caches
echo "Clearing user caches..."
rm -rf ~/Library/Caches/*

# Font caches
echo "Clearing font caches..."
sudo atsutil databases -remove

# DNS cache
echo "Flushing DNS cache..."
sudo dscacheutil -flushcache
sudo killall -HUP mDNSResponder

# Kernel extension cache
echo "Clearing kext cache..."
sudo kextcache --clear-staging

# System temporary files
echo "Clearing temporary files..."
sudo rm -rf /private/var/tmp/*
rm -rf ~/Library/Caches/TemporaryItems/*

echo "Cache cleanup complete. Please restart your Mac."
Save this as a script:
# Create the script
nano ~/Desktop/cache_cleanup.sh

# Make it executable
chmod +x ~/Desktop/cache_cleanup.sh

# Run it
~/Desktop/cache_cleanup.sh
Fix 5: Memory Management Terminal Commands
Purge Inactive Memory:
# Purge inactive memory (requires admin password)
sudo purge
This command forces macOS to clear inactive memory and file caches. It can provide temporary relief when memory pressure is high.
Monitor and Auto-Kill High Memory Processes:
# Script to kill processes using more than 10GB
while true; do
  ps aux | awk '$6 > 10000000 {print $2, $11, $6/1024/1024 " GB"}' | while read pid name mem; do
    echo "Warning: $name (PID $pid) using $mem"
    # Uncomment next line to auto-kill (use with caution)
    # kill $pid
  done
  sleep 60
done
Create Memory Pressure Report:
# Generate detailed memory report
{
  echo "=== Memory Report $(date) ==="
  echo ""
  echo "=== VM Statistics ==="
  vm_stat
  echo ""
  echo "=== Swap Usage ==="
  sysctl vm.swapusage
  echo ""
  echo "=== Top Memory Processes ==="
  ps aux --sort=-%mem | head -15
  echo ""
  echo "=== Memory Pressure ==="
  memory_pressure
} > ~/Desktop/memory_report_$(date +%Y%m%d_%H%M%S).txt

echo "Report saved to Desktop"
Specific Fixes for Common Apps
Calculator Memory Leak Fix
The Calculator app memory leak has been one of the most reported issues. Here's a comprehensive fix:
Step 1: Force Quit and Clear Data
# Kill Calculator
killall Calculator

# Remove all Calculator data
rm -rf ~/Library/Containers/com.apple.calculator/
rm -rf ~/Library/Group\ Containers/*Calculator*/
defaults delete com.apple.calculator
Step 2: Reinstall Calculator (if available)
Since Calculator is a system app, you can try resetting it through System Preferences:
- Open System Settings
- Go to Privacy & Security > Full Disk Access
- Temporarily grant Terminal full disk access
- Run:
sudo rm -rf /System/Applications/Calculator.app - Restart your Mac
- macOS will restore Calculator on next boot
Alternative: Use Alternative Calculator Apps
Until Apple fixes this bug, consider using alternatives:
- Numi (Free/Paid) - Text-based calculator
- PCalc (Paid) - Full-featured scientific calculator
- Spotlight - Just type calculations in Spotlight search
Pages Memory Leak Fix
Step 1: Close and Clean Up
# Force quit Pages
killall Pages

# Clear Pages caches and temporary files
rm -rf ~/Library/Containers/com.apple.iWork.Pages/Data/Library/Caches/
rm -rf ~/Library/Containers/com.apple.iWork.Pages/Data/tmp/
Step 2: Disable Auto-Save Temporarily
The auto-save feature contributes to memory accumulation:
- Open Pages
- Go to Pages menu > Settings
- In the General tab, uncheck options related to auto-save if available
- Save documents manually with
Command + S
Step 3: Manage Document Versions
Document versions consume memory:
# Clear version storage (Warning: loses version history)
rm -rf ~/.DocumentRevisions-V100/
Step 4: Export Instead of Save
For large documents, export to a new file rather than saving:
- Go to File > Export To > Pages
- Save as a new file
- Delete the old file
- Continue working on the exported version
Safari Memory Management Fix
Safari's memory leaks are particularly frustrating because each tab compounds the problem.
Step 1: Limit Tab Usage
- Keep fewer than 10 tabs open at a time
- Use Reading List instead of keeping tabs open for later
- Close tabs you're not actively using
Step 2: Clear Website Data Regularly
# Script to clear Safari data weekly
# Add to crontab for automation

# Clear Safari caches
rm -rf ~/Library/Caches/com.apple.Safari/
rm -rf ~/Library/Safari/LocalStorage/
rm -rf ~/Library/Safari/Databases/

# Clear WebKit caches
rm -rf ~/Library/Caches/com.apple.WebKit.WebContent/
rm -rf ~/Library/Caches/com.apple.WebKit.Networking/
Step 3: Disable Safari Extensions
Extensions can contribute to memory leaks:
- Open Safari
- Go to Safari > Settings > Extensions
- Disable all extensions
- Re-enable one at a time to identify problematic ones
Step 4: Reset Safari Completely
# Complete Safari reset
mv ~/Library/Safari ~/Desktop/Safari_Backup
mv ~/Library/Caches/com.apple.Safari ~/Desktop/Safari_Cache_Backup
mv ~/Library/Preferences/com.apple.Safari.plist ~/Desktop/Safari_Prefs_Backup

# Restart Safari - it will create fresh files
Step 5: Use Safari's Built-in Memory Management
Safari in macOS Tahoe has automatic tab unloading, but you can force it:
- Right-click on a tab
- Select "Close Other Tabs" to reduce memory
- Use "Tab Groups" to organize and reduce active tabs
Finder Memory Reset
Finder memory leaks cause system-wide slowdowns since Finder is always running.
Step 1: Restart Finder
# Restart Finder
killall Finder

# Or use Option + Right-click on Finder in Dock > Relaunch
Step 2: Clear Finder Preferences
# Reset Finder preferences
defaults delete com.apple.finder

# Clear Finder caches
rm -rf ~/Library/Caches/com.apple.finder/

# Clear Finder saved state
rm -rf ~/Library/Saved\ Application\ State/com.apple.finder.savedState/

# Restart Finder
killall Finder
Step 3: Rebuild Finder Database
# Rebuild Launch Services database
/System/Library/Frameworks/CoreServices.framework/Frameworks/LaunchServices.framework/Support/lsregister -kill -r -domain local -domain system -domain user

# Restart Finder
killall Finder
Step 4: Optimize Finder Settings
- Open Finder Preferences (
Command + ,) - Uncheck "Show all filename extensions"
- In "Advanced", reduce items in Recent Folders
- Disable iCloud Desktop sync if not needed
Photos App Memory Issues
Step 1: Repair Photos Library
- Close Photos
- Hold
Option + Commandwhile opening Photos - Click "Repair" in the dialog that appears
- Wait for repair to complete
Step 2: Optimize Photos Storage
- Open Photos
- Go to Photos > Settings > iCloud
- Enable "Optimize Mac Storage" to reduce local storage
Step 3: Clear Photos Cache
# Clear Photos cache
rm -rf ~/Library/Caches/com.apple.Photos/
rm -rf ~/Library/Containers/com.apple.Photos/Data/Library/Caches/
Step 4: Pause Sync During Active Use
If Photos is syncing while you're working, pause it:
- Open Photos
- Click on the sync indicator in the title bar
- Click "Pause" to stop sync temporarily
System-Wide Solutions
Solution 1: Disable Reduce Transparency
The Liquid Glass transparency effects in macOS Tahoe can contribute to memory issues. Disabling them may help:
- Open System Settings
- Go to Accessibility > Display
- Enable "Reduce Transparency"
Via Terminal:
# Disable transparency
defaults write com.apple.universalaccess reduceTransparency -bool true

# Restart affected processes
killall Finder
killall Dock
Solution 2: Reduce Motion Settings
Animations consume resources and may contribute to memory accumulation:
- Open System Settings
- Go to Accessibility > Display
- Enable "Reduce Motion"
Via Terminal:
# Disable motion
defaults write com.apple.universalaccess reduceMotion -bool true
Solution 3: Safe Mode Boot for Diagnostics
Safe Mode disables non-essential system components and can help identify issues:
For Apple Silicon Macs:
- Shut down your Mac completely
- Press and hold the power button until "Loading startup options" appears
- Select your startup disk
- Press and hold Shift, then click "Continue in Safe Mode"
For Intel Macs:
- Shut down your Mac
- Turn on your Mac and immediately press and hold Shift
- Release Shift when you see the login window
In Safe Mode:
- Test if memory leaks persist
- If they don't, the issue may be with startup items or extensions
- If they do, the issue is with core system components
Solution 4: NVRAM/PRAM Reset
Resetting NVRAM can resolve various system issues:
For Apple Silicon Macs:
NVRAM resets automatically during a full shutdown. Simply:
- Shut down your Mac
- Wait 30 seconds
- Turn it back on
For Intel Macs:
- Shut down your Mac
- Turn it on and immediately press and hold:
Option + Command + P + R - Hold for about 20 seconds
- Release the keys and let your Mac start normally
Solution 5: Reset System Management Controller (SMC)
For Intel Macs with persistent memory issues:
MacBooks with T2 chip:
- Shut down your Mac
- Press and hold:
Control + Option + Shifton the left side for 7 seconds - Keep holding and also press the power button for another 7 seconds
- Release all keys, wait a few seconds
- Press the power button to turn on your Mac
Desktop Intel Macs:
- Shut down your Mac
- Unplug the power cord
- Wait 15 seconds
- Plug the power cord back in
- Wait 5 seconds
- Turn on your Mac
Solution 6: Create a New User Account
Memory leaks can sometimes be profile-specific:
- Open System Settings > Users & Groups
- Click "Add User"
- Create a new administrator account
- Log out of your current account
- Log into the new account
- Test if memory issues persist
If the new account doesn't have issues, migrate your data gradually.
Preventive Measures and Best Practices
Daily Maintenance Routine
Morning:
- Check Activity Monitor for any processes with unusual memory usage
- Close any apps you don't need
- Clear browser tabs from previous day
Throughout the Day:
- Monitor memory pressure indicator
- Force quit apps showing signs of memory leaks
- Save work frequently (in case restart is needed)
Evening:
- Restart your Mac to clear all memory
- Let Time Machine complete its backup
- Close all applications before sleep
Weekly Maintenance
Run Cache Cleanup:
# Weekly maintenance script
#!/bin/bash

echo "Running weekly Mac maintenance..."

# Clear user caches
rm -rf ~/Library/Caches/*

# Clear system caches (requires password)
sudo rm -rf /Library/Caches/*

# Rebuild Spotlight index
sudo mdutil -E /

# Verify disk
diskutil verifyVolume /

# Clear DNS cache
sudo dscacheutil -flushcache

echo "Weekly maintenance complete!"
Check for Updates:
- Open System Settings > General > Software Update
- Install any available macOS updates
- Update all App Store applications
Application-Specific Settings
Safari Optimization:
- Enable "Remove history items" > After one week
- Limit website data storage
- Disable "Allow websites to check if Apple Pay is set up"
- Enable "Prevent cross-site tracking"
Mail Optimization:
- Set "Download Attachments" to "None" or "Recent"
- Disable "Load remote content in messages"
- Archive old emails instead of keeping in inbox
Photos Optimization:
- Enable "Optimize Mac Storage"
- Disable "Shared Albums" if not using
- Use Smart Albums to organize instead of manual albums
For comprehensive RAM management strategies, check our guide on macOS Tahoe RAM management and memory optimization.
Monitor System Health
Install Memory Monitor Tools:
Consider using third-party monitoring tools:
- Stats (Free, Open Source) - Menu bar system monitor
- iStat Menus (Paid) - Comprehensive system monitoring
- Memory Clean 3 (Free/Paid) - Memory optimization tool
Create Activity Monitor Desktop Widget:
- Open Activity Monitor
- Go to Window > CPU History (or Memory)
- This creates a small floating window
- Keep it visible to monitor system health
When to Consider Downgrading to macOS Sequoia
Evaluation Criteria
Consider downgrading if:
- Memory leaks persist after all fixes
- Your productivity is significantly impacted
- You cannot wait for Apple to release a fix
- Critical apps are unusable
- Your Mac frequently becomes unresponsive
Downgrade Process Overview
Before downgrading, understand that:
- You need a full backup of your data
- Some Tahoe features won't be available
- Documents saved in newer formats may need conversion
- The process requires time and technical comfort
For detailed downgrade instructions, see our comprehensive guide on downgrading macOS Tahoe to Sequoia.
Creating a Bootable Sequoia Installer
Prerequisites:
- 16GB+ USB drive
- Downloaded macOS Sequoia installer
- Reliable internet connection
Steps:
# Download macOS Sequoia from App Store (may require finding older version)
# Then create bootable installer:

sudo /Applications/Install\ macOS\ Sequoia.app/Contents/Resources/createinstallmedia --volume /Volumes/MyUSBDrive
Important Considerations Before Downgrading
Data Compatibility:
- Backup all important data to external drive
- Export documents to universal formats (PDF, DOCX)
- Export photos to external storage
- Backup Keychain data
Application Compatibility:
- Check which apps you use require Tahoe
- Some apps may have updated to only support Tahoe
- Note any app-specific settings that need reconfiguration
Advanced Troubleshooting Techniques
Using Console App for Deep Diagnostics
The Console app provides access to system logs that can reveal the source of memory issues:
Accessing Console:
- Open Finder > Applications > Utilities > Console
- In the left sidebar, select your Mac
- Use the search bar to filter relevant logs
Useful Search Filters:
# Memory-related logs
memory pressure
jetsam
vm_compressor
dirty memory

# App-specific issues
Calculator
Pages
Safari
WindowServer
Interpreting Jetsam Events:
Jetsam is macOS's memory management system that terminates apps when memory is critically low:
# View recent jetsam events
log show --predicate 'eventMessage contains "jetsam"' --last 24h
Sample Jetsam Log Entry:
memorystatus: killing pid 1234 [Calculator] (per-process-limit) -
memorystatus_available_pages: 12345 purgeable_pages: 0
This indicates Calculator was killed for exceeding its memory allocation.
Memory Leak Detection with leaks Command
For developers and advanced users, the leaks command provides detailed memory leak analysis:
# Check for memory leaks in a specific process
leaks Calculator

# Check for leaks with detailed output
leaks -atExit -- Calculator

# Save leak report to file
leaks Calculator > ~/Desktop/calculator_leaks.txt
Interpreting Results:
Process 12345: 47 leaks for 3840 total leaked bytes.
47 (3.75K) ROOT LEAK: <CFString 0x7f8a2c004a50>
This shows the app has 47 memory leaks totaling 3.75KB, which accumulate over time.
Monitoring with DTrace (Advanced)
DTrace provides powerful real-time memory monitoring:
# Monitor memory allocations for Calculator
sudo dtrace -n 'pid$target::malloc:entry { @[ustack(3)] = sum(arg0); }' -p $(pgrep Calculator)

# Track which functions allocate most memory
sudo dtrace -n 'syscall::mmap:entry /execname == "Calculator"/ { @[ustack()] = count(); }'
Note: DTrace requires disabling SIP, which is not recommended for most users.
Using Sample Command for CPU and Memory Analysis
The sample command captures a snapshot of an application's state:
# Sample Calculator for 5 seconds
sample Calculator 5 -file ~/Desktop/calculator_sample.txt

# Sample with specific options
sample Calculator 10 -wait -mayDie -file ~/Desktop/sample_output.txt
This creates a detailed report of what the application was doing, including memory allocation patterns.
Virtual Memory Analysis
Understanding virtual memory helps diagnose memory pressure:
# Detailed VM statistics
vm_stat 1

# Explanation of key metrics:
# Pages free: Available physical memory pages
# Pages active: Recently accessed memory
# Pages inactive: Memory not recently used but still in RAM
# Pages speculative: Prefetched data that might be needed
# Pages wired down: Kernel memory that can't be paged out
# Pages purgeable: Memory that can be freed immediately
# File-backed pages: Memory containing file data
# Anonymous pages: Memory not backed by files (app data)
# Pages stored in compressor: Compressed inactive memory
# Pages occupied by compressor: RAM used by compression engine
Calculate Actual Free Memory:
# Script to calculate real available memory
#!/bin/bash

page_size=$(pagesize)
vm_info=$(vm_stat)

free=$(echo "$vm_info" | grep "Pages free" | awk '{print $3}' | tr -d '.')
inactive=$(echo "$vm_info" | grep "Pages inactive" | awk '{print $3}' | tr -d '.')
speculative=$(echo "$vm_info" | grep "Pages speculative" | awk '{print $3}' | tr -d '.')
purgeable=$(echo "$vm_info" | grep "Pages purgeable" | awk '{print $3}' | tr -d '.')

total_available=$(( (free + inactive + speculative + purgeable) * page_size / 1024 / 1024 ))
echo "Available memory: ${total_available} MB"
Swap File Analysis and Management
When RAM fills up, macOS uses swap files on disk:
# Check current swap usage
sysctl vm.swapusage

# Example output:
# vm.swapusage: total = 2048.00M  used = 1536.00M  free = 512.00M

# List swap files
ls -lh /private/var/vm/

# Monitor swap file growth
watch -n 1 'ls -lh /private/var/vm/ && sysctl vm.swapusage'
Warning Signs:
- Swap usage consistently over 50% of total
- Multiple swap files (swapfile0, swapfile1, swapfile2, etc.)
- Swap files larger than your physical RAM
Clearing Swap (Requires Restart):
The only safe way to clear swap is to restart your Mac. Attempting to delete swap files while running will cause system instability.
Memory Compression Analysis
macOS compresses inactive memory to fit more in RAM:
# Check compression statistics
vm_stat | grep "compressor"

# Example output:
# Pages stored in compressor: 1234567
# Pages occupied by compressor: 234567
Compression Ratio:
# Calculate compression ratio
stored=$(vm_stat | grep "Pages stored in compressor" | awk '{print $6}' | tr -d '.')
occupied=$(vm_stat | grep "Pages occupied by compressor" | awk '{print $6}' | tr -d '.')
ratio=$(echo "scale=2; $stored / $occupied" | bc)
echo "Compression ratio: ${ratio}:1"
A healthy ratio is typically 2:1 to 4:1. If it's approaching 1:1, compression is becoming less effective.
Frequently Asked Questions
General Memory Leak Questions
Q: Why is Calculator using 42GB of RAM?
A: This is a known bug in macOS Tahoe 26 where the Calculator app fails to release memory after performing calculations. The new Liquid Glass UI framework appears to have introduced memory retention issues. Apple is aware of the problem, and a fix is expected in a future update.
Q: Will Apple fix these memory leaks?
A: Yes, Apple typically addresses critical bugs like these in point updates. The macOS Tahoe 26.1.1 or 26.2 update is expected to contain fixes for the most severe memory leak issues. Check System Settings > General > Software Update regularly.
Q: How much RAM should my Mac apps normally use?
A: Normal memory usage varies by app:
- Calculator: 20-50 MB
- Pages: 200 MB - 1 GB (depending on document)
- Safari: 500 MB - 2 GB total (varies with tabs)
- Finder: 200-500 MB
- Mail: 200-500 MB
- Photos: 500 MB - 2 GB
If apps are using significantly more, you may have a memory leak.
Q: Is 8GB of RAM enough for macOS Tahoe?
A: While 8GB technically meets minimum requirements, users with 8GB RAM are experiencing more severe impacts from memory leaks. 16GB or more is recommended for comfortable use with macOS Tahoe, especially until memory management bugs are fixed.
Troubleshooting Questions
Q: How often should I restart my Mac to prevent memory issues?
A: Until Apple fixes the memory leaks, consider restarting daily. A fresh restart clears all accumulated memory and provides a clean slate. At minimum, restart when memory pressure turns yellow or red.
Q: Will installing more RAM help with memory leaks?
A: Not directly. Memory leaks will eventually consume any amount of RAM you have. More RAM just delays when you'll experience problems. However, more RAM does provide more buffer time between necessary restarts.
Q: Should I disable SIP to try advanced fixes?
A: No. Disabling System Integrity Protection is not necessary for fixing memory leaks and significantly reduces your Mac's security. All effective fixes can be performed with SIP enabled.
Q: Can memory leaks damage my Mac?
A: Memory leaks themselves won't cause hardware damage. However, the heavy swap usage they cause increases disk writes, which over very long periods could affect SSD longevity. The bigger concern is lost productivity and potential data loss if you need to force restart during unsaved work.
App-Specific Questions
Q: Why does Safari use so much memory with just a few tabs?
A: Safari in macOS Tahoe has issues with both web content memory management and its own process memory. Each tab runs in isolation for security, but memory isn't being released properly when tabs are closed. Using Safari's "Manage Website Data" feature regularly helps.
Q: Should I switch from Safari to Chrome to avoid memory issues?
A: Chrome has its own memory considerations. While Safari's memory leaks in Tahoe are problematic, Chrome typically uses more baseline memory. Firefox or Safari Technology Preview may be alternatives worth trying.
Q: Can I use an older version of Calculator or Pages?
A: No, you cannot install older versions of Apple's built-in apps. They're tied to the operating system version. Third-party alternatives are your best option until Apple releases fixes.
Prevention Questions
Q: Will creating a new user account fix memory leaks?
A: It may help if the leaks are related to corrupted user-specific data or preferences. However, if the leaks are system-wide bugs (as most current issues are), a new user account won't help.
Q: Should I use third-party memory cleaning apps?
A: Some are helpful for monitoring, but be cautious. macOS already manages memory efficiently, and aggressive "cleaning" apps can sometimes cause more problems. Tools like "Stats" for monitoring are fine, but avoid apps that claim to "boost" or "free" memory automatically.
Q: Is it safe to increase swap file size?
A: macOS manages swap automatically, and manually adjusting it is not recommended. Increasing swap wouldn't fix the underlying memory leak - it would just allow leaks to grow larger before causing problems.
Update and Future Questions
Q: When will Apple fix these memory leaks?
A: Apple has acknowledged memory management issues in macOS Tahoe. Based on historical patterns, significant fixes typically arrive in .1 or .2 updates. Keep your system updated through System Settings > General > Software Update.
Q: Should I wait to upgrade to macOS Tahoe?
A: If you haven't upgraded yet and memory stability is important for your workflow, consider waiting until macOS Tahoe 26.2 or later. You can check community forums and release notes to verify when memory issues have been addressed.
Q: Will upgrading from 26.0.1 to 26.1 help?
A: macOS Tahoe 26.1 included some memory management improvements, but not all leaks were fixed. Check the release notes for specific fixes, and always backup before upgrading.
Technical Questions
Q: What's the difference between Real Memory and Virtual Memory in Activity Monitor?
A: Real Memory (also called Physical Memory or Resident Set Size) is the actual RAM currently being used by a process. Virtual Memory is the total address space allocated to the process, which includes both RAM and disk-based swap space. A process can have high Virtual Memory but low Real Memory if much of its data has been paged out to disk.
Q: Why does Memory Pressure show green when I'm running out of RAM?
A: Memory Pressure indicates how efficiently macOS is managing memory, not just raw usage. If macOS is successfully compressing memory and the system remains responsive, the indicator may stay green even with high usage. It turns yellow or red when the system struggles to keep up with memory demands.
Q: Can I increase the maximum memory available to an app?
A: On macOS, you cannot directly set memory limits for individual apps (unlike some Linux systems). macOS manages memory dynamically. However, you can influence behavior by:
- Closing other apps to free more memory
- Increasing swap space indirectly by having more free disk space
- Using
ulimitin Terminal sessions (limited effectiveness)
Q: What does "kernel_task" high memory usage mean?
A: The kernel_task process handles core macOS operations including memory management, I/O, and hardware communication. High kernel_task memory usage often indicates:
- The system is actively managing heavy memory pressure
- There are many file system operations occurring
- Hardware drivers are consuming resources
- The Mac is throttling to manage heat
This is usually normal behavior, not a bug.
Q: How do I know if my SSD is being damaged by excessive swap usage?
A: Modern SSDs can handle significant write operations, but monitoring helps:
# Check SSD health (on Apple Silicon)
system_profiler SPNVMeDataType | grep "Data Units Written"

# For Intel Macs with smartctl
brew install smartmontools
smartctl -a disk0
If "Data Units Written" is increasing rapidly (gigabytes per day) during normal use, excessive swap may be contributing to wear.
Q: Should I use a RAM disk to reduce swap wear?
A: RAM disks use physical memory to create a fast virtual drive. While they can speed up certain operations, they:
- Reduce available RAM (counterproductive for memory leaks)
- Don't persist across restarts
- Aren't typically necessary for normal macOS use
This is not recommended as a solution for memory leaks.
Workflow and Productivity Questions
Q: How can I continue working despite memory leaks?
A: Develop a workflow that accommodates the current limitations:
- Save frequently - Use
Command + Shabitually - Monitor actively - Keep Activity Monitor visible
- Schedule restarts - Restart during lunch or at end of day
- Use alternatives - Third-party apps for problematic built-in apps
- Close unused apps - Don't leave apps running "just in case"
- Use web versions - Safari Memory issues? Try Chrome for specific sites
Q: My Mac crashed and I lost work. How do I prevent this?
A: Implement multiple safeguards:
- Auto-save apps - Most Apple apps auto-save; ensure this is enabled
- Time Machine - Configure hourly backups
- Cloud sync - Use iCloud Drive or Dropbox for important files
- Manual saves - Save every few minutes for critical work
- Version control - For code, use Git and commit frequently
- External backups - Clone your drive weekly
Q: Are there any apps that help manage Mac memory automatically?
A: Several third-party apps can help:
- CleanMyMac X - Comprehensive system maintenance with memory tools
- Memory Clean 3 - Dedicated memory monitoring and freeing
- OnyX - Free system maintenance utility
- AppCleaner - Helps fully uninstall apps including cached data
- DaisyDisk - Visualizes disk usage including swap
Note: Be cautious with "memory optimizer" apps that claim to "free" or "boost" RAM. macOS already manages memory effectively, and aggressive optimization can cause instability.
Reporting and Support Questions
Q: How do I report memory leaks to Apple?
A: Apple encourages bug reports through:
- Feedback Assistant - feedback.apple.com or use the Feedback Assistant app
- Bug Reporter - bugreport.apple.com (requires Apple Developer account)
Include in your report:
- macOS version (e.g., 26.0.1)
- Mac model and year
- Affected app and version
- Steps to reproduce
- Screenshots from Activity Monitor
- System profiler data:
system_profiler > ~/Desktop/system_report.txt - Memory report generated with commands from this guide
Q: Is there an Apple Support article about Tahoe memory issues?
A: Apple typically doesn't publish articles acknowledging specific bugs, but they do publish general memory management guidance. Search support.apple.com for "memory" or "Activity Monitor" for official Apple documentation on understanding and managing Mac memory.
Q: Can AppleCare help with memory leak issues?
A: AppleCare support can help verify if you're experiencing a known issue and may offer workarounds. However, they cannot fix software bugs - that requires Apple's engineering team to release an update. AppleCare can:
- Confirm you're on the latest macOS version
- Walk through basic troubleshooting
- Document your case for engineering review
- Suggest workarounds
Summary: Quick Reference Guide
Emergency Memory Relief (Do This First)
# 1. Check what's using memory
top -o mem

# 2. Kill the worst offender (replace ProcessName)
killall ProcessName

# 3. Purge inactive memory
sudo purge

# 4. Check improvement
vm_stat | head -10
Daily Maintenance Checklist
- Check Activity Monitor memory tab
- Force quit any apps using >5GB unexpectedly
- Close unused browser tabs
- Clear Safari website data if using heavily
- Restart if memory pressure is yellow/red
Weekly Maintenance Checklist
- Clear user caches:
rm -rf ~/Library/Caches/* - Check for macOS updates
- Review startup items
- Run First Aid on startup disk
- Verify Time Machine backup is current
Monthly Maintenance Checklist
- Full system restart with all apps closed
- Clear system caches (with cache cleanup script)
- Review and remove unused apps
- Check SSD health
- Archive old files to external storage
Conclusion
The memory leak issues in macOS Tahoe 26 represent some of the most significant stability problems in recent macOS history. While frustrating, most issues can be managed through the techniques outlined in this guide:
Key Takeaways:
- Monitor actively - Use Activity Monitor to catch memory leaks early
- Act quickly - Force quit apps when you notice unusual memory growth
- Maintain regularly - Clear caches and restart your Mac daily
- Stay updated - Install macOS updates as they become available
- Have alternatives - Consider third-party apps for critical workflows
- Backup always - Ensure Time Machine is running before any major troubleshooting
Apple has historically been responsive to critical bugs, and fixes are expected in upcoming macOS updates. In the meantime, the strategies in this guide will help you maintain productivity while minimizing the impact of these memory management issues.
For ongoing performance optimization beyond memory issues, explore our comprehensive guide on macOS Tahoe RAM management and our general Mac performance troubleshooting guide.
Remember: These issues are software bugs that Apple will fix. With proper management, your Mac can remain productive even while we await permanent solutions.